AED Market Update
27 Jun 2026 • 01:18 GMT
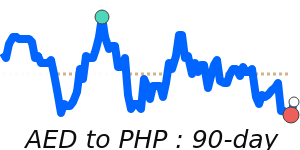
The UAE Dirham (AED) has remained quite stable against the US dollar, holding steady at its three-month average of approximately 0.2723. Despite the recent US dollar strength driven by increased expectations of a Federal Reserve rate hike and global uncertainties, the AED has not shown significant movement against the dollar.
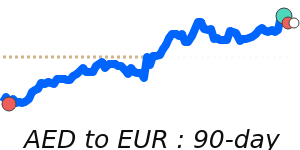
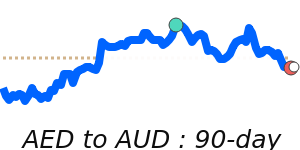
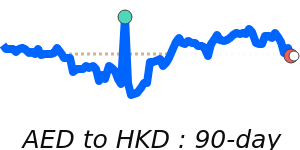
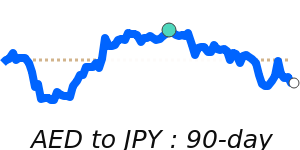
However, against other major currencies, the AED has seen some upward moves. It has strengthened slightly against the euro, trading at around 0.2390—about 2% above its recent average. Similarly, the AED has gained against the Japanese yen, reaching near 44.06, which is at a 90-day high and about 1.5% above its average. The currency has also appreciated against the Australian dollar and Swiss franc by roughly 2.8% and 2.4%, respectively, reflecting a broad, yet modest, regional resilience.
These movements are influenced by the UAE’s ongoing economic reforms, including the recent launch of digital payment systems and infrastructure projects such as passenger rail services. While the US dollar remains strong, the AED’s stability against the dollar persists amid global market jitters. Overall, the AED continues to show measured resilience amid a dynamic international environment.