Switch .com Best Exchange Rates .com Best Exchange Rates .com Best Exchange Rates
BER

    Norwegian krone Exchange Update, Chart & History

    NOK Markets Update - Our review of Norwegian krone Forecasts and News plus Charts and Historic Rates. Check NOK Trends over various time periods.


    Norwegian krone (NOK) Market Update

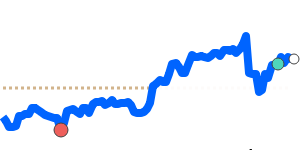
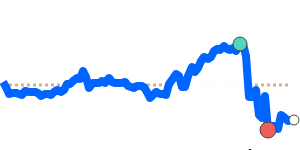
    The USD to NOK exchange rate has been influenced by a complex interplay of economic factors and market sentiment. Currently, the USD is trading at 10.41, which is approximately 3.6% below its three-month average of 10.8, showcasing significant volatility in recent weeks. Analysts highlight that the pair has traded within a notable 11.2% range, fluctuating between 10.33 to 11.49, indicating market uncertainty.

    The trajectory of the USD has recently been buoyed by hopes for improved US-China trade relations, as the market reacted positively to indications from China about openness to trade talks. This optimism momentarily strengthened the dollar, but caution prevails as focus shifts to upcoming economic indicators, particularly April's non-farm payroll figures. A potential slowdown in job creation could negatively impact the dollar's value. Moreover, concerns regarding US Treasury yields and President Trump’s tariff policies suggest that the dollar may face headwinds, as questions about its support as a safe-haven currency continue to emerge.

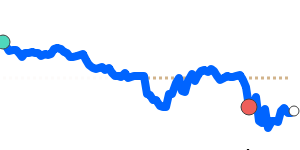
    On the other hand, the Norwegian krone (NOK) has been on a remarkable upswing, gaining approximately 9% year-to-date against the dollar. This rise can be attributed to positive sentiment surrounding European economic prospects and an unexpected inflation increase within Norway. The markets appear to anticipate limited easing measures from the Norges Bank, with only slight adjustments likely in the coming months. However, experts from ABN-Amro caution that while there may be room for further gains in the NOK, risks remain, especially regarding the potential for a rebound in EUR/NOK to around 11.50 in the second quarter, largely influenced by shifting sentiment towards US tariffs on Europe.

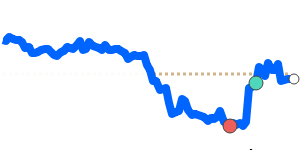
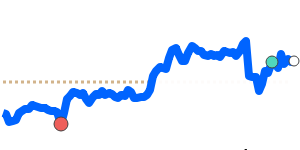
    The NOK's strength is intrinsically linked to oil prices, as Norway is a major oil exporter. Presently, oil prices are at 90-day lows, around 61.29, which is significantly below the three-month average of 70.61. This decline, coupled with a volatile trading range of 25.6%, from 61.29 to 76.99, indicates that fluctuations in commodity prices will continue to play a crucial role in shaping the NOK's outlook against the USD.

    In summary, forex experts indicate that the USD to NOK exchange rate is set against a backdrop of mixed economic signals, marked by strong performance in the krone driven by local inflation and broader European sentiment, while the dollar grapples with concerns of economic slowdown and geopolitical shifts. As such, businesses and individuals engaged in currency transactions should remain attuned to these developments to effectively manage their foreign exchange exposure.


    US dollar to Norwegian krone - USD/NOK Trend

     
    USD to NOK at 10.41 is 3.6% below its 3-month average of 10.8, having traded in a quite volatile 11.2% range from 10.33 to 11.49
    |
     
    1 USD =
    10.41We compare provider deals to this wholesale mid-market rate. Read more
    NOK
     
    -0.2%
     
    Track Rate

    View My Rate Tracker


    Compare & Save on Exchange Rates

    Exchange rates can vary significantly between banks and currency exchange providers, so it's important to compare rates from different sources before making a conversion.

    The below table makes it easy to calculate and compare the Total Cost you are being charged on currency rates and the possible savings of using a foreign exchange provider rather than your bank.


    Loading exchange rates...


    Top NOK Rates


    Norwegian krone to US dollar
    NOKUSD 90 day chart

    NOK to USD at 0.096044 is 3.6% above its 3-month average of 0.09268, having traded in a quite volatile 11.3% range from 0.087052 to 0.096846
    NOK to USD
    0.096044
    +0.2%

    Norwegian krone to Euro
    NOKEUR 90 day chart

    NOK to EUR is at 14-day highs near 0.085008, just 0.6% below its 3-month average of 0.085488, having traded in a relatively stable 7.2% range from 0.082554 to 0.088488
    NOK to EUR
    0.084975
    +0.1%
    14d-highs

    Norwegian krone to British pound
    NOKGBP 90 day chart

    NOK to GBP is at 14-day highs near 0.072384, just 0.6% above its 3-month average of 0.071939, having traded in a quite stable 5.2% range from 0.070293 to 0.073921
    NOK to GBP
    0.072396
    +0.3%
    14d-highs

    Japanese yen to Norwegian krone
    JPY to NOK at 0.071856 is 1.4% below its 3-month average of 0.072882, having traded in a fairly volatile 8.3% range from 0.069390 to 0.075147
    JPY to NOK
    0.071856
    +0.1%

    Canadian dollar to Norwegian krone
    CADNOK 90 day chart

    CAD to NOK is at 7-day highs near 7.5370, just 0.9% below its 3-month average of 7.6036, having traded in a fairly volatile 8.1% range from 7.2952 to 7.8881
    CAD to NOK
    7.5331

    A-Z


    Norwegian krone to Danish krone
    NOKDKK 90 day chart

    NOK to DKK is at 14-day highs near 0.6344, just 0.6% below its 3-month average of 0.638, having traded in a relatively stable 7.2% range from 0.6158 to 0.6603
    NOK to DKK
    0.6343
    +0.1%
    14d-highs

    Norwegian krone to Euro
    NOKEUR 90 day chart

    NOK to EUR is at 14-day highs near 0.085008, just 0.6% below its 3-month average of 0.085488, having traded in a relatively stable 7.2% range from 0.082554 to 0.088488
    NOK to EUR
    0.084975
    +0.1%
    14d-highs

    Norwegian krone to British pound
    NOKGBP 90 day chart

    NOK to GBP is at 14-day highs near 0.072384, just 0.6% above its 3-month average of 0.071939, having traded in a quite stable 5.2% range from 0.070293 to 0.073921
    NOK to GBP
    0.072396
    +0.3%
    14d-highs

    Norwegian krone to Indian rupee
    NOKINR 90 day chart

    NOK to INR at 8.1282 is 1.7% above its 3-month average of 7.994, having traded in a fairly volatile 9.6% range from 7.5354 to 8.2591
    NOK to INR
    8.1282
    +0.1%
    14d-lows

    Norwegian krone to Swedish krona
    NOKSEK 90 day chart

    NOK to SEK at 0.9273 is 1.9% below its 3-month average of 0.9456, having traded in a relatively stable 7.7% range from 0.9106 to 0.9803
    NOK to SEK
    0.9273
    -0.7%
    14d-highs

    Norwegian krone to US dollar
    NOKUSD 90 day chart

    NOK to USD at 0.096044 is 3.6% above its 3-month average of 0.09268, having traded in a quite volatile 11.3% range from 0.087052 to 0.096846
    NOK to USD
    0.096044
    +0.2%