NZD Market Update
27 Jun 2026 • 01:12 GMT
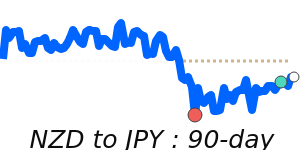
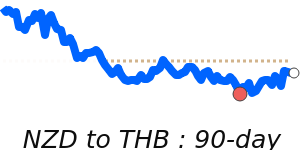
The New Zealand Dollar (NZD) remains weaker against the US dollar, trading at around 0.5646. This is roughly 3.3% below its recent three-month average of 0.5836. Over the past week, the NZD/USD pair has experienced some fluctuations, but overall it has stayed within a narrow range, highlighting cautious trading amid global uncertainties.
The USD has gained strength recently, driven by investor expectations of an interest rate hike from the Federal Reserve, possibly as soon as September. This has put downward pressure on the NZD and many other currencies. Despite this, the NZD has shown signs of resilience, with projections from some banks suggesting it could stabilize around 0.60 later this year, supported by anticipated rate increases from the Reserve Bank of New Zealand.
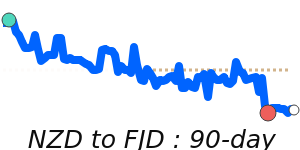
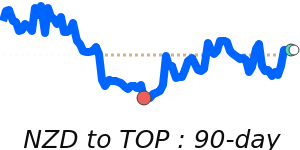
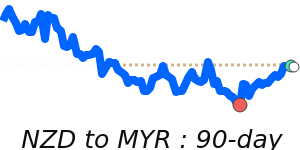
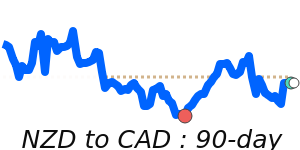
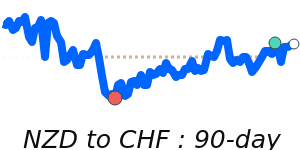
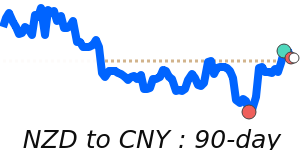
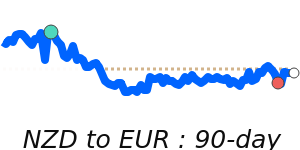
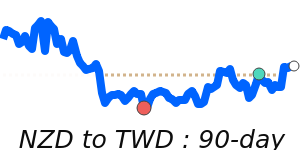
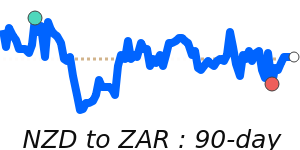
Other NZD pairs remain relatively steady; for example, NZD/AUD and NZD/CHF are trading close to their average levels, while the NZD/EUR and NZD/INR are near their recent lows. Market watchers are keeping an eye on upcoming central bank signals and US rate plans, which could influence the Kiwi's direction in the coming months.
📊 Quick forecast view
🔴 Mild downside
0.5540 – 0.5650
🌍 Global risk sentiment
⚪ Range-bound