Switch .com Best Exchange Rates .com Best Exchange Rates .com Best Exchange Rates
BER

    South African rand Exchange Update, Chart & History

    ZAR Markets Update - Our review of South African rand Forecasts and News plus Charts and Historic Rates. Check ZAR Trends over various time periods.


    South African rand (ZAR) Market Update

    The South African Rand (ZAR) is experiencing notable movements in the currency market amid a challenging external environment. Recent forecasts and analysis suggest that the ongoing trade tensions, particularly the 30% reciprocal tariff imposed by the US on South African goods, are significantly influencing investor sentiment toward the ZAR. As South Africa heavily relies on foreign investment to bridge its budget and current account deficits, fluctuations in global market conditions are acutely felt.

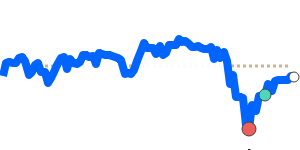
    Currently, the ZAR to USD exchange rate is at a 30-day high of approximately 0.054373, representing a modest rise of 0.9% above its 3-month average of 0.053871. In recent trading, the pair has demonstrated volatility, oscillating within a 9.3% range from a low of 0.050563 to a high of 0.055274. Analysts indicate that any shifts in global risk appetite could further sway the ZAR's performance against the dollar.

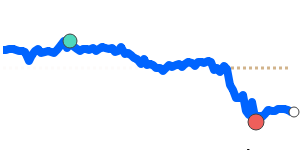
    In the ZAR to EUR pairing, the currency is trading at 14-day highs near 0.048119, but remains 3.3% below its 3-month average of 0.049744. The volatility in this pair has been particularly pronounced, with fluctuations within a 14.4% range from 0.045978 to 0.052601. Economists suggest that the euro's strength relative to other currencies continues to place pressure on the ZAR.

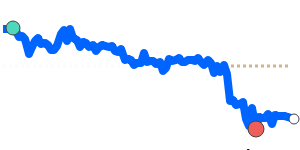
    The GBP/ZAR exchange rate also shows recent strengths, with the ZAR currently at 0.040973, marking a 30-day high yet remaining 2.1% below its 3-month average of 0.041844. This pair has traded within a notably volatile range of 10.7%, with values fluctuating between 0.039609 and 0.043842. Forecasters note that geopolitical uncertainties could keep this volatility alive as market participants react to new developments.

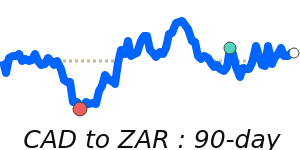
    Lastly, the ZAR to JPY exchange rate stands at 7.8776, which is 1.3% under its 3-month average of 7.9843. This pair has seen fluctuations within a 12.7% range from 7.3967 to 8.3356, underscoring the currency's exposure to global market dynamics.

    Overall, the ZAR remains sensitive to international economic conditions and trade conflicts. Markets are advised to monitor developments closely, as shifts in sentiment could lead to further volatility in the upcoming weeks.


    US dollar to South African rand - USD/ZAR Trend

     
    USD to ZAR is at 30-day lows near 18.39, just 1.0% below its 3-month average of 18.57, having traded in a fairly volatile 9.3% range from 18.09 to 19.78
    |
     
    1 USD =
    18.39We compare provider deals to this wholesale mid-market rate. Read more
    ZAR
     
    -0.9%
    30d-lows
     
    Track Rate

    View My Rate Tracker


    Compare & Save on Exchange Rates

    Exchange rates can vary significantly between banks and currency exchange providers, so it's important to compare rates from different sources before making a conversion.

    The below table makes it easy to calculate and compare the Total Cost you are being charged on currency rates and the possible savings of using a foreign exchange provider rather than your bank.


    Loading exchange rates...


    Top ZAR Rates


    South African rand to US dollar
    ZARUSD 90 day chart

    ZAR to USD is at 30-day highs near 0.054373, just 0.9% above its 3-month average of 0.053871, having traded in a fairly volatile 9.3% range from 0.050563 to 0.055274
    ZAR to USD
    0.054366
    +0.9%
    30d-highs

    South African rand to Euro
    ZAREUR 90 day chart

    ZAR to EUR is at 14-day highs near 0.048119, 3.3% below its 3-month average of 0.049744, having traded in a rather volatile 14.4% range from 0.045978 to 0.052601
    ZAR to EUR
    0.048100
    +0.8%
    14d-highs

    South African rand to British pound
    ZARGBP 90 day chart

    ZAR to GBP is at 30-day highs near 0.040973, 2.1% below its 3-month average of 0.041844, having traded in a quite volatile 10.7% range from 0.039609 to 0.043842
    ZAR to GBP
    0.040980
    +1.0%
    30d-highs

    Japanese yen to South African rand
    JPY to ZAR is at 14-day lows near 0.1269, 1.2% above its 3-month average of 0.1254, having traded in a rather volatile 12.7% range from 0.1200 to 0.1352
    JPY to ZAR
    0.1269
    -0.6%
    14d-lows

    Canadian dollar to South African rand
    CADZAR 90 day chart

    CAD to ZAR is at 14-day lows near 13.31, 1.8% above its 3-month average of 13.08, having traded in a quite volatile 10.1% range from 12.62 to 13.89
    CAD to ZAR
    13.31
    -0.7%
    14d-lows

    A-Z


    South African rand to Euro
    ZAREUR 90 day chart

    ZAR to EUR is at 14-day highs near 0.048119, 3.3% below its 3-month average of 0.049744, having traded in a rather volatile 14.4% range from 0.045978 to 0.052601
    ZAR to EUR
    0.048100
    +0.8%
    14d-highs

    South African rand to British pound
    ZARGBP 90 day chart

    ZAR to GBP is at 30-day highs near 0.040973, 2.1% below its 3-month average of 0.041844, having traded in a quite volatile 10.7% range from 0.039609 to 0.043842
    ZAR to GBP
    0.040980
    +1.0%
    30d-highs

    South African rand to Indian rupee
    ZARINR 90 day chart

    ZAR to INR at 4.6010 is 1.0% below its 3-month average of 4.6478, having traded in a fairly volatile 9.8% range from 4.3671 to 4.7969
    ZAR to INR
    4.6010
    +0.9%

    South African rand to US dollar
    ZARUSD 90 day chart

    ZAR to USD is at 30-day highs near 0.054373, just 0.9% above its 3-month average of 0.053871, having traded in a fairly volatile 9.3% range from 0.050563 to 0.055274
    ZAR to USD
    0.054366
    +0.9%
    30d-highs