Switch .com Best Exchange Rates .com Best Exchange Rates .com Best Exchange Rates
BER

United Arab Emirates dirham Markets

AED Currency Update - Our review of United Arab Emirates dirham forecasts and news plus charts and historic rates. Check AED Trends over various time periods.


Recent developments point to a complex outlook for the UAE Dirham (AED) as geopolitical tensions, economic forecasts, and trade negotiations interplay to influence its value. Following Israel's military actions against Iran, markets across the UAE and the broader Middle East faced declines, leading to increased volatility and rising oil prices. Such geopolitical instability typically fosters a risk-averse market environment, which can impact currency strength.

Economically, a positive projection from the Arab Monetary Fund anticipates a growth rate of 6.2% for the UAE in 2025. This expected growth is largely driven by sectors such as tourism, real estate, and international trade. However, concerns over the performance of the non-oil private sector have emerged, with May data showing a slowdown to its lowest growth rate in almost four years. This juxtaposition of growth forecasts alongside challenges in diversification may create fluctuations in the AED's value.

Conversely, ongoing trade negotiations with the U.S. aimed at reducing tariffs on steel and aluminum exports could significantly impact trade balances and currency dynamics. Positive outcomes from such negotiations may strengthen the AED, particularly if they enhance the UAE's trade relationships.

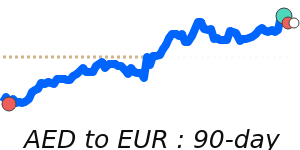
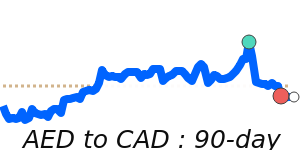
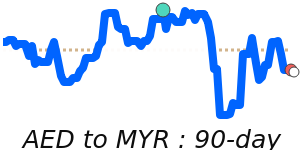
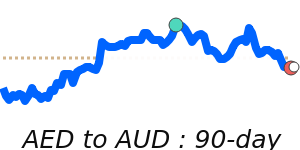
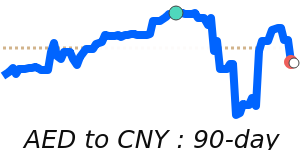
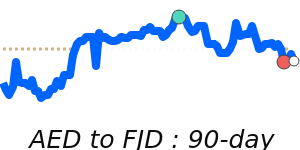
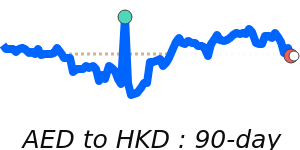
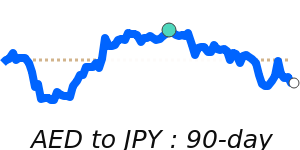
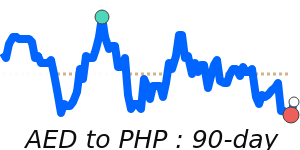
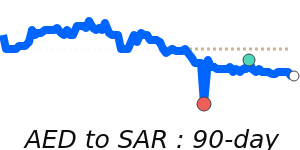
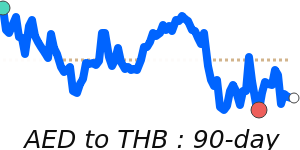
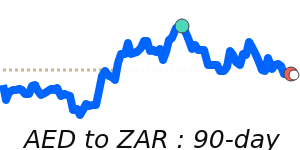
From a market perspective, the AED has shown stability against major currencies over the past weeks. The exchange rate for AED to USD remains steady at its three-month average of 0.2723. The AED to EUR is trading at 0.2341, which is 1.5% below its three-month average, demonstrating relatively stable trading ranges. In contrast, the AED to GBP is slightly above its average, while the AED to JPY is at 90-day highs, trading 2.7% above its three-month average.

As the currency market continues to respond to both domestic developments and international events, businesses and individuals engaging in international transactions should remain vigilant and informed about the factors influencing the AED.


US dollar to United Arab Emirates dirham - USD/AED Trend

 
USD to AED is steady at its 3-month average 3.6729.
|
 
1 USD =
3.6725We compare provider deals to this wholesale mid-market rate. Read more
AED
 
 
Track Rate

View My Rate Tracker


Compare & Save on Exchange Rates

Exchange rates can vary significantly between banks and currency exchange providers, so it's important to compare rates from different sources before making a conversion.

The below table makes it easy to calculate and compare the Total Cost you are being charged on currency rates and the possible savings of using a foreign exchange provider rather than your bank.


Loading exchange rates...


Top AED Rates


United Arab Emirates dirham to US dollar
AEDUSD 90 day chart

AED to USD is steady at its 3-month average 0.2723.
AED to USD
0.2723

United Arab Emirates dirham to Indian rupee
AEDINR 90 day chart

AED to INR is at 14-day highs near 23.45, just 0.6% above its 3-month average of 23.3, having traded in a very stable 3.0% range from 22.93 to 23.61
AED to INR
23.46
+0.1%
14d-highs

United Arab Emirates dirham to British pound
AEDGBP 90 day chart

AED to GBP at 0.2030 is just above its 3-month average, having traded in a quite stable 4.3% range from 0.1981 to 0.2066
AED to GBP
0.2030

United Arab Emirates dirham to Pakistani rupee
AEDPKR 90 day chart

AED to PKR is at 14-day highs near 77.59, just 0.8% above its 3-month average of 76.97, having traded in a stable 1.7% range from 76.34 to 77.62
AED to PKR
77.58
14d-highs

United Arab Emirates dirham to Singapore dollar
AEDSGD 90 day chart

AED to SGD at 0.3497 is just below its 3-month average, having traded in a very stable 3.5% range from 0.3462 to 0.3583
AED to SGD
0.3498
-0.1%

United Arab Emirates dirham to Euro
AEDEUR 90 day chart

AED to EUR at 0.2341 is 1.5% below its 3-month average of 0.2376, having traded in a relatively stable 6.5% range from 0.2306 to 0.2456
AED to EUR
0.2342
-0.3%

United Arab Emirates dirham to Canadian dollar
AEDCAD 90 day chart

AED to CAD at 0.3739 is near its 3-month average, having traded in a very stable 3.0% range from 0.3695 to 0.3807
AED to CAD
0.3740
-0.1%

United Arab Emirates dirham to Malaysian ringgit
AEDMYR 90 day chart

AED to MYR at 1.1560 is just 0.5% below its 3-month average of 1.1617, having traded in a quite stable 5.0% range from 1.1428 to 1.2000
AED to MYR
1.1562

United Arab Emirates dirham to Australian dollar
AEDAUD 90 day chart

AED to AUD at 0.4185 is just 0.5% below its 3-month average of 0.4206, having traded in a very stable 3.6% range from 0.4132 to 0.4281
AED to AUD
0.4185
-0.3%

A-Z


United Arab Emirates dirham to Australian dollar
AEDAUD 90 day chart

AED to AUD at 0.4185 is just 0.5% below its 3-month average of 0.4206, having traded in a very stable 3.6% range from 0.4132 to 0.4281
AED to AUD
0.4185
-0.3%

United Arab Emirates dirham to Canadian dollar
AEDCAD 90 day chart

AED to CAD at 0.3739 is near its 3-month average, having traded in a very stable 3.0% range from 0.3695 to 0.3807
AED to CAD
0.3740
-0.1%

United Arab Emirates dirham to Chinese yuan
AEDCNY 90 day chart

AED to CNY at 1.9542 is just below its 3-month average, having traded in a very stable 2.1% range from 1.9507 to 1.9908
AED to CNY
1.9545
-0.1%
14d-highs

United Arab Emirates dirham to Euro
AEDEUR 90 day chart

AED to EUR at 0.2341 is 1.5% below its 3-month average of 0.2376, having traded in a relatively stable 6.5% range from 0.2306 to 0.2456
AED to EUR
0.2342
-0.3%

United Arab Emirates dirham to Fijian dollar
AEDFJD 90 day chart

AED to FJD at 0.6140 is near its 3-month average, having traded in a very stable 3.2% range from 0.6079 to 0.6275
AED to FJD
0.6141
-0.2%

United Arab Emirates dirham to British pound
AEDGBP 90 day chart

AED to GBP at 0.2030 is just above its 3-month average, having traded in a quite stable 4.3% range from 0.1981 to 0.2066
AED to GBP
0.2030

United Arab Emirates dirham to Hong Kong dollar
AEDHKD 90 day chart

AED to HKD at 2.1365 is just above its 3-month average, having traded in a stable 1.3% range from 2.1100 to 2.1377
AED to HKD
2.1356
90d-highs

United Arab Emirates dirham to Indian rupee
AEDINR 90 day chart

AED to INR is at 14-day highs near 23.45, just 0.6% above its 3-month average of 23.3, having traded in a very stable 3.0% range from 22.93 to 23.61
AED to INR
23.46
+0.1%
14d-highs

United Arab Emirates dirham to Japanese yen
AEDJPY 90 day chart

AED to JPY is at 90-day highs near 40.53, 2.7% above its 3-month average of 39.43, having traded in a quite stable 5.7% range from 38.35 to 40.53
AED to JPY
40.52
+0.1%
90d-highs

United Arab Emirates dirham to Malaysian ringgit
AEDMYR 90 day chart

AED to MYR at 1.1560 is just 0.5% below its 3-month average of 1.1617, having traded in a quite stable 5.0% range from 1.1428 to 1.2000
AED to MYR
1.1562

United Arab Emirates dirham to Omani rial
AED to OMR is at 30-day highs near 0.1047, near its 3-month average, having traded in a stable 0.5% range from 0.1043 to 0.1048
AED to OMR
0.1047
30d-highs

United Arab Emirates dirham to Philippine peso
AEDPHP 90 day chart

AED to PHP at 15.55 is 1.7% above its 3-month average of 15.29, having traded in a very stable 3.5% range from 15.07 to 15.60
AED to PHP
15.55
-0.2%
90d-highs

United Arab Emirates dirham to Pakistani rupee
AEDPKR 90 day chart

AED to PKR is at 14-day highs near 77.59, just 0.8% above its 3-month average of 76.97, having traded in a stable 1.7% range from 76.34 to 77.62
AED to PKR
77.58
14d-highs

United Arab Emirates dirham to Qatari rial
AED to QAR is at 90-day lows near 0.9910, near its 3-month average, having traded in a stable 0.5% range from 0.9910 to 0.9956
AED to QAR
0.9913
90d-lows

United Arab Emirates dirham to Saudi riyal
AEDSAR 90 day chart

AED to SAR is at 60-day lows near 1.0209, near its 3-month average, having traded in a stable 0.6% range from 1.0172 to 1.0230
AED to SAR
1.0214
60d-lows

United Arab Emirates dirham to Singapore dollar
AEDSGD 90 day chart

AED to SGD at 0.3497 is just below its 3-month average, having traded in a very stable 3.5% range from 0.3462 to 0.3583
AED to SGD
0.3498
-0.1%

United Arab Emirates dirham to Thai baht
AEDTHB 90 day chart

AED to THB is at 7-day lows near 8.8130, 1.3% below its 3-month average of 8.9302, having traded in a very stable 4.0% range from 8.7945 to 9.1451
AED to THB
8.8236
-0.4%

United Arab Emirates dirham to New Taiwan dollar
AED to TWD is at 14-day highs near 8.0106, 2.3% below its 3-month average of 8.1956, having traded in a rather volatile 12.7% range from 7.8751 to 8.8727
AED to TWD
8.0083
14d-highs

United Arab Emirates dirham to Vietnamese dong
AED to VND is at 7-day highs near 7122, just above its 3-month average, having traded in a stable 1.3% range from 7046 to 7138
AED to VND
7,122.1
+0.1%

United Arab Emirates dirham to South African rand
AEDZAR 90 day chart

AED to ZAR is at 7-day lows near 4.8218, 1.8% below its 3-month average of 4.9089, having traded in a relatively stable 7.4% range from 4.7705 to 5.1242
AED to ZAR
4.8224
-0.7%