AUD Market Update
21 Jul 2026 • 00:27 GMT
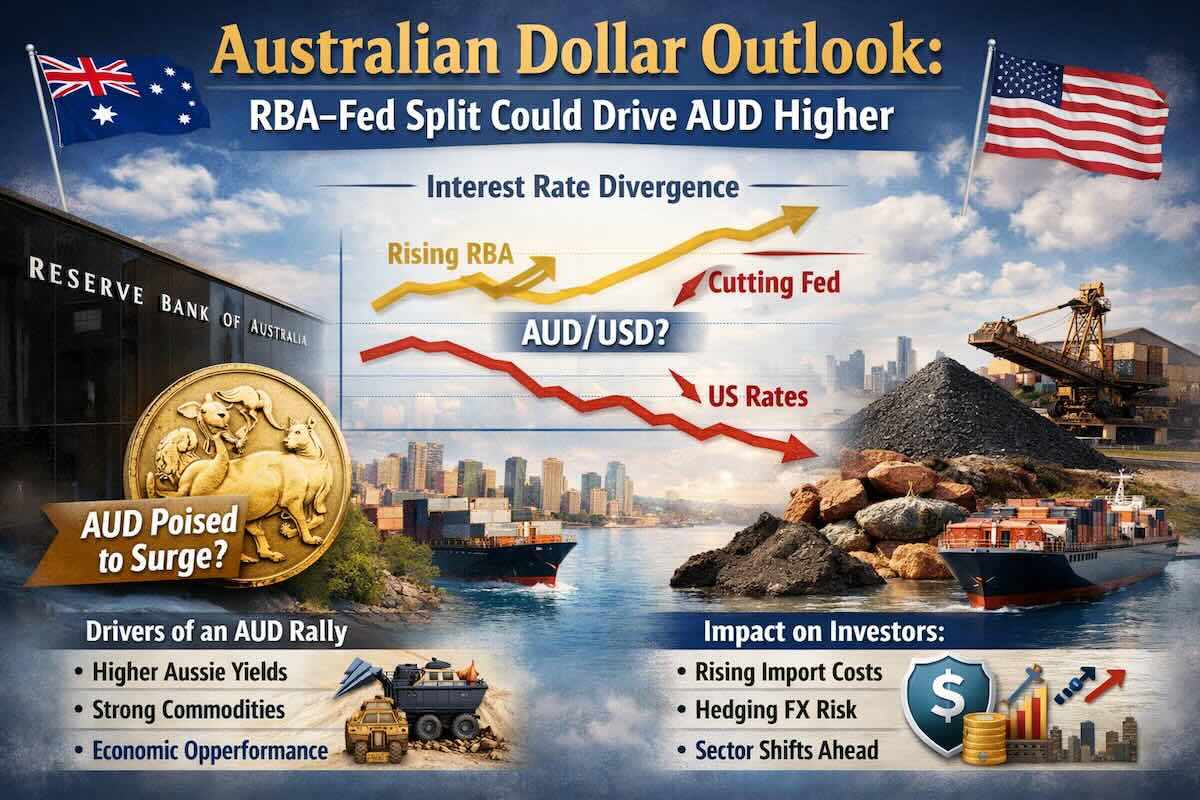
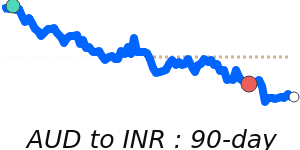
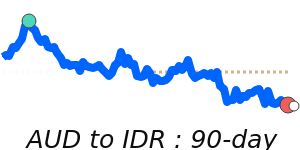
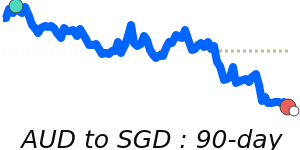
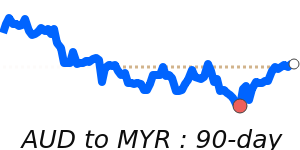
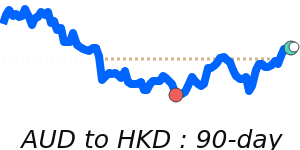
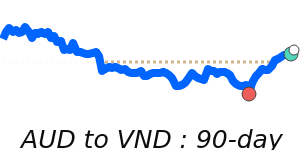
The Australian Dollar (AUD) remains close to its recent levels against the US Dollar, trading around 0.7000. This is about 1% below its 3-month average of 0.7073, highlighting some cautiousness in the market. The AUD has traded within a relatively narrow range from 0.6887 to 0.7258 over recent months, suggesting limited volatility.
While the AUD has struggled to clear the 0.7000 resistance, support from domestic demand and a cautious stance by the Reserve Bank of Australia (RBA) has helped keep it stable. Meanwhile, the US dollar remains relatively strong, driven by ongoing inflation concerns and expectations of sustained higher US interest rates.
Looking ahead, the AUD’s near-term direction will likely depend on both local economic indicators and developments in US monetary policy. Updates on the US inflation outlook and global geopolitical tensions could bring some volatility. For now, expect the AUD to hover around its current levels, with potential for gradual moves higher if the RBA maintains a cautious but supportive stance.
📊 Quick forecast view
🔴 Mild downside
0.6770 – 0.7000
🌍 Global risk sentiment
⚪ Range-bound