GBP Market Update
21 Jul 2026 • 00:27 GMT
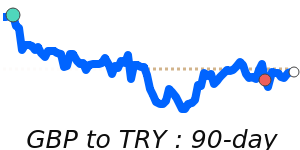
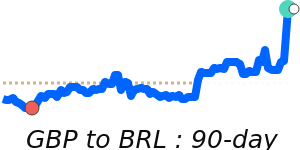
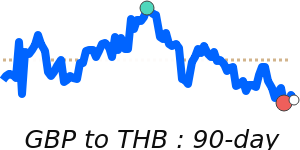
The British Pound has been relatively stable against the US Dollar in recent days, trading near 1.3431. This matches its 3-month average, with the pair mainly moving within a tight range between 1.3168 and 1.3634. Recent dips below 1.3400 have pressured the Pound slightly lower due to increased risk aversion and a stronger dollar. Nonetheless, some analysts see these pullbacks as opportunities for the Pound to rebound, potentially targeting 1.3650 if risk sentiment improves.
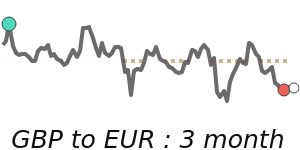
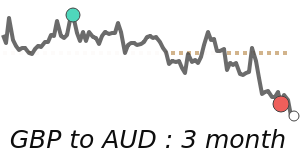
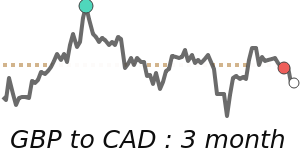
against the euro, the Pound remains slightly strong at 1.1766, just above its recent 3-month average. The GBP has also strengthened slightly versus the Japanese Yen, trading at 218.2, above its longer-term average as well. Meanwhile, against the aussie and Canadian dollars, the Pound has dipped to recent 14-day lows near 1.9187 and 1.89, respectively, although these levels are still close to their longer-term averages.
Looking ahead, UK political uncertainties and decisions from the Bank of England will continue to influence the Pound's direction. Although the dollar remains resilient, especially with strong inflation data and geopolitical tensions, the GBP's near-term outlook suggests range-bound trading with potential for a modest lift if risk appetite improves.
📊 Quick forecast view
🔴 Mild downside
1.3170 – 1.3630
🏦 Central bank policy divergence
⚪ Range-bound