JPY Market Update
21 Jul 2026 • 00:27 GMT
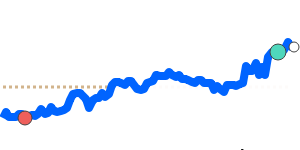
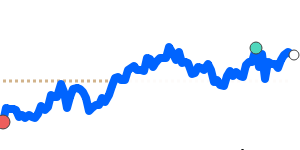
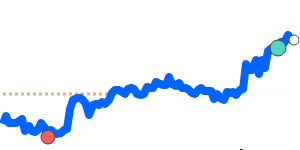
The Japanese yen continues to face downward pressure against the US dollar, with USD/JPY climbing to near 162.5, its highest point in the past week and about 1.5% above its three-month average of 160.1. Despite Japan’s recent intervention efforts and a small rate hike by the Bank of Japan to 1.00%, the yen remains relatively weak, largely influenced by the resilient US dollar amid ongoing global uncertainties.
The yen’s weakness is also reflected in its position against other currencies, with recent declines against the euro, pound, and Australian dollar. The pair has traded within a stable range below recent highs, indicating cautious market sentiment. Traders are watching for any possible Japanese government intervention and shifts in oil prices, which can influence Japan’s energy-import-reliant economy further.
While the yen may stabilize in the near term, sustained US dollar strength suggests that further downside risk remains if US interest rates stay high and global geopolitical tensions persist. Market participants should stay alert to potential policy responses from Japanese authorities and broader economic developments impacting the yen.
📊 Quick forecast view
🟢 Mild upside
162.5000 – 165.4460
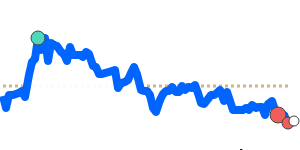
🌍 Global risk sentiment
⚪ Range-bound