EUR Market Update
22 Jul 2026 • 00:26 GMT
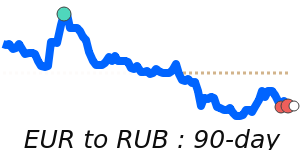
The euro is currently near its 7-day lows against the US dollar at around 1.1398, reflecting a decline of about 1.4% from its 3-month average of 1.1561. Despite this dip, the euro remains within a relatively narrow trading range, trading between 1.1359 and 1.1789 over recent weeks. The market continues to weigh geopolitical tensions in the Middle East, which have boosted safe-haven currencies like the USD and CHF, supporting a cautious approach for the euro.
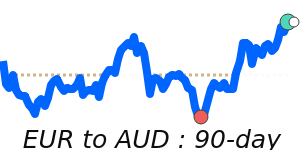
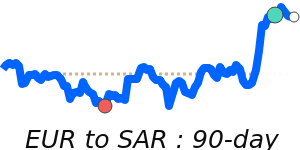
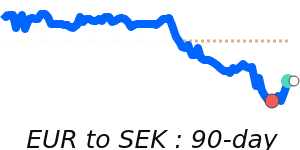
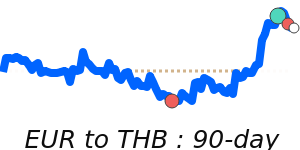
In contrast, the euro has gained slightly against the Japanese yen, trading near 186.1, close to 30-day highs and just above its 3-month average of 185.1. Meanwhile, against the British pound, EUR is slightly below its 3-month average near 0.8523, and against the Australian dollar, the euro remains near 1.6286, near its 30-day lows.
Market focus remains on geopolitical developments and energy prices, which could impact risk sentiment and EUR/USD movements. Keep an eye on upcoming European Central Bank meetings and regional risk factors that could sway euro direction in the near term.
📊 Quick forecast view
🔴 Mild downside
1.1160 – 1.1400
🌍 Global risk sentiment
⚪ Range-bound