EUR Market Update
21 Jul 2026 • 00:26 GMT
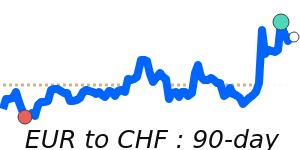
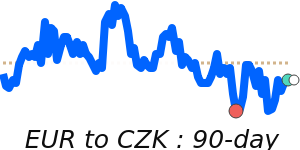
The euro remains fairly steady against the dollar at around 1.1416, which is slightly below its three-month average of 1.1565. Despite some volatility, EUR/USD has traded within a narrow, stable range of about 3.8%, between 1.1359 and 1.1789.
Current market sentiment is supported by geopolitical tensions in the Middle East, particularly around the Strait of Hormuz, which has helped keep demand for safe-haven currencies like the euro elevated. However, a sharp move lower toward 1.10 could occur if oil prices surge or if dollar strength picks up following strong US economic data.
The euro's near-term outlook remains cautiously optimistic as long as it stays above key support at 1.1405. Most analysts expect the pair to fluctuate between 1.1405 and 1.1450 in the short term, with external factors such as energy prices and US monetary policy movements likely to be the main drivers of its direction. Trends over the next weeks will hinge on geopolitical developments and the upcoming ECB’s policy stance.
📊 Quick forecast view
🟢 Mild upside
1.1360 – 1.1560
🌍 Global risk sentiment
⚪ Range-bound