HKD Market Update
24 Jun 2026 • 00:29 GMT
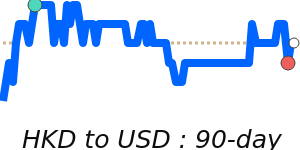
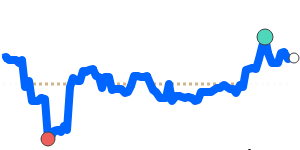
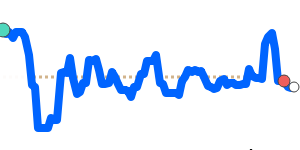
The Hong Kong dollar (HKD) has been relatively steady against the US dollar (USD), trading near 90-day lows of 0.1275. The pair has stayed within a narrow 0.3% range from 0.1275 to 0.1279, reflecting limited movement as the USD firmed up recently. This strength is mainly driven by increased safe-haven demand amid broader market concerns and positive US economic data, including manufacturing and services sector growth.
Despite these US factors, the HKD remains anchored by Hong Kong’s linked exchange rate system, which keeps it tightly pegged around 7.75 to 7.85 to the USD. Leading bank forecasts suggest this stability will persist through the end of the year, with the pair expected to stay within its established band.
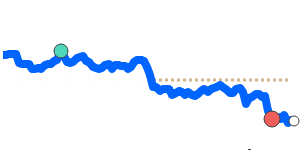
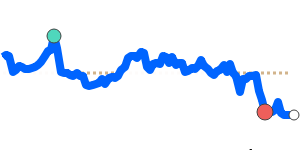
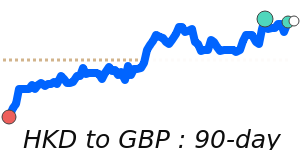
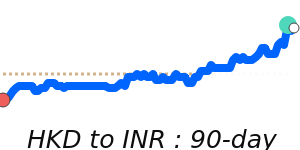
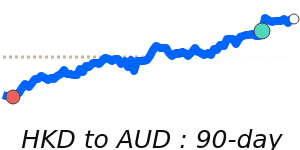
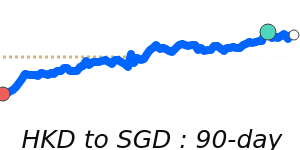
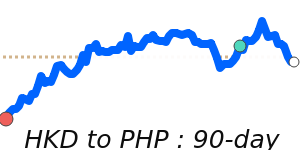
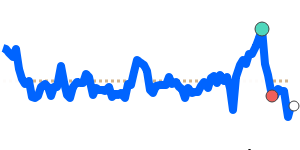
Meanwhile, other major currencies like the euro, pound, and Japanese yen have seen the HKD strengthen against them, hitting 90-day highs. Notably, the HKD has risen against the euro and pound by about 2%, and against the yen by around 1.4%. These moves reflect not only US dollar dynamics but also regional factors and market sentiment. Overall, the HKD remains stable within its peg, with limited volatility ahead.