HKD Market Update
02 Jul 2026 • 00:29 GMT
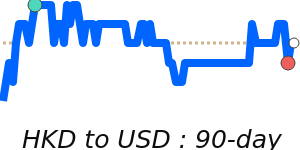
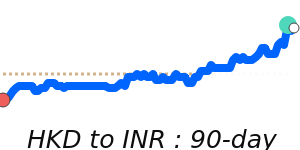
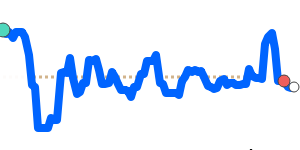
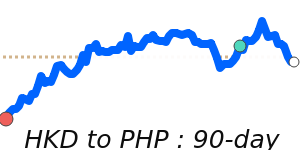
The Hong Kong dollar (HKD) remains close to its recent 90-day lows against the US dollar, trading near 0.1275. This level is around its three-month average and has shown stability within a narrow range from 0.1275 to 0.1278. The HKD continues to follow the peg with the USD, which itself has been recently strong amid expectations of a potential US interest rate hike later this year.
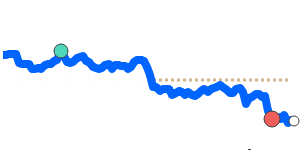
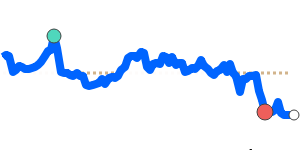
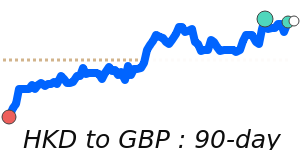
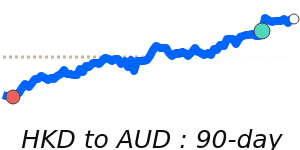
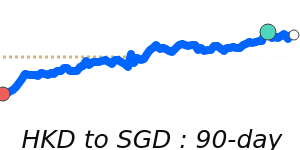
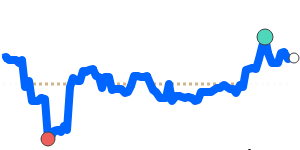
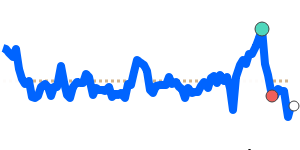
While the US dollar is showing strength, it has paused its recent rally, not reversed, as investors await more US economic data and Fed signals. This cautious environment supports the HKD's stability. Meanwhile, other currency benchmarks indicate a mixed picture: the HKD has strengthened against the Japanese yen, trading near 20.73, and remains above its three-month average. It also trades modestly above its average against the euro, pound, and other currencies, reflecting overall steady confidence.
Looking ahead, the HKD is expected to remain anchored within the peg system, with little change unless there are significant shifts in US monetary policy or geopolitical factors. Market participants should watch for upcoming US economic releases and Fed comments, as they could influence the US dollar and, consequently, the HKD.