JPY Market Update
27 Jun 2026 • 01:11 GMT
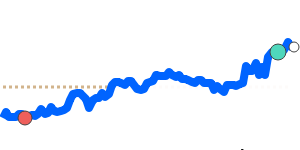
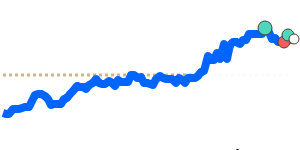
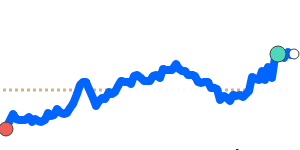
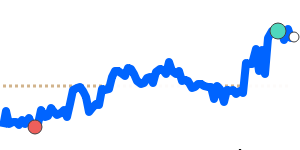
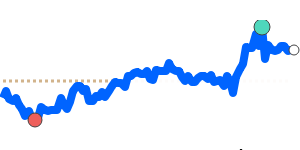
The Japanese yen remains a key focus in the forex market amid attention on possible intervention. Currently, USD/JPY is near 161.8, its highest level in 90 days, well above the 159.4 average from the past three months. This rally has been steady within a narrow range, but the ascent toward key levels has traders watching closely. Speculation about Japanese authorities stepping in to curb yen weakness has increased, especially as implied market volatility climbs.
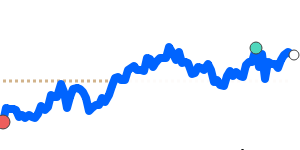
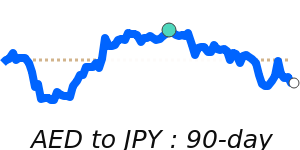
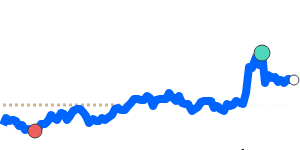
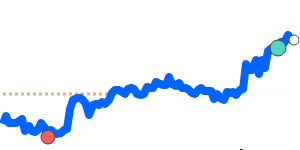
While the yen has weakened against the dollar, other major currencies like the euro and the pound have traded relatively steadily against the yen, with minor fluctuations. The AUD and CAD have seen slight increases, trading near two-month highs, hinting at moderate risk appetite.
Overall, traders should monitor official signals from Japanese policymakers and any shifts in market volatility, as these could trigger intervention concerns. Despite the current momentum, some forecasts suggest the yen may stabilize or even regain momentum later in the year if global uncertainties ease. Keep an eye on geopolitical developments and economic data, which could influence the yen’s next move.
📊 Quick forecast view
🟢 Mild upside
161.8000 – 164.6320
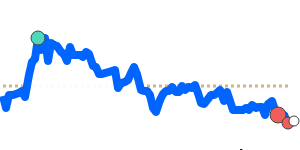
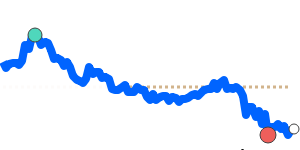
🌍 Global risk sentiment
🔴 Downtrend