JPY Market Update
22 Jul 2026 • 00:27 GMT
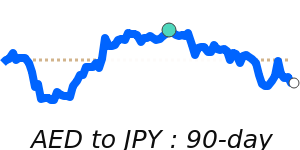
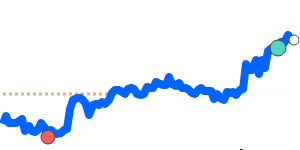
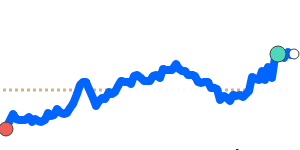
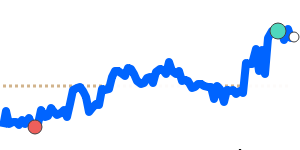
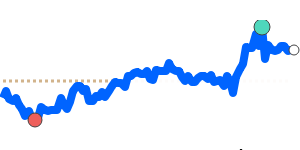
The Japanese yen has recently remained under pressure, trading near 90-day lows against the US dollar at around 0.006128, which is 1.9% below its three-month average. Despite Japan's recent intervention efforts – including spending nearly ¥10 trillion in May to strengthen the yen – large gains have been limited as the USD remains supported by safe-haven flows amid ongoing geopolitical tensions and rising oil prices.
The Bank of Japan’s recent rate hike to 1.00% has had minimal impact on the yen’s weakness, especially with the Federal Reserve maintaining its hawkish stance. Meanwhile, the yen's decline is also influenced by its correlation with rising energy costs, given Japan’s dependence on energy imports. Market watchers continue to monitor potential interventions from Japan’s authorities if the yen weakens beyond certain levels.
Against other currencies like the euro and the pound, the yen is also near multi-month lows, but in a relatively stable range. Overall, traders should keep an eye on U.S. rate policies and any further Japanese government measures that might support or curb the yen’s decline.
📊 Quick forecast view
🔴 Mild downside
160.3440 – 163.2000
🌍 Global risk sentiment
🔴 Downtrend