MYR Market Update
22 Jul 2026 • 00:33 GMT
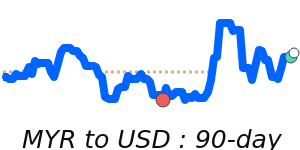
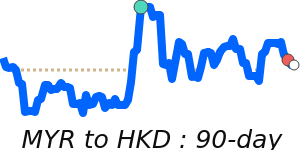
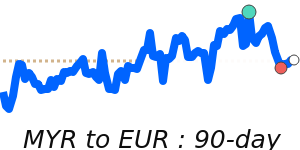
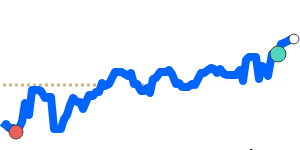
The Malaysian Ringgit (MYR) remains modestly weaker against the US dollar, trading at around 0.2445 USD. This is approximately 1.6% below its three-month average of 0.2486, with the pair trading within a stable range of 0.2410 to 0.2558 over recent months. The global US dollar has shown resilience due to ongoing geopolitical tensions, mainly in the Middle East, keeping safe-haven demand high. However, the MYR’s fundamentals remain supportive, with Malaysia’s economy expected to grow steadily in 2026, driven by strong domestic demand and foreign investment.
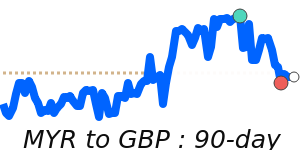
Market forecasts suggest the USD/MYR could remain around 3.85 to 3.90 by year-end. Factors that could influence the pair include shifts in US interest rate policies and developments in global oil markets. Meanwhile, the MYR has gained modest strength against currencies such as the Japanese Yen and Swiss Franc, trading near multi-week highs. Overall, with Malaysia's resilient economy and stable external conditions, the ringgit is likely to maintain its current gentle upward trajectory in the coming months.
📊 Quick forecast view
🔴 Mild downside
0.2370 – 0.2440
🌍 Global risk sentiment
🟢 Uptrend