SGD Market Update
27 Jun 2026 • 01:13 GMT
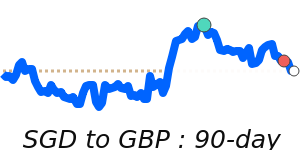
The Singapore dollar (SGD) remains relatively stable, but recent moves suggest cautiousness. Against the US dollar (USD), the SGD is currently at 0.7726, which is about 1.1% below its three-month average of 0.781. Although the SGD has mostly traded within a narrow range, signs point to it approaching the tightening limits set by the Monetary Authority of Singapore (MAS). The SGD's gain against the USD has paused, and some market players are watching for possible intervention if the currency moves too far above its policy band.
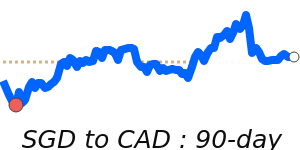
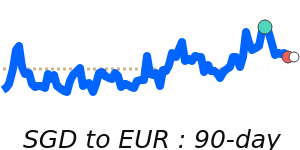
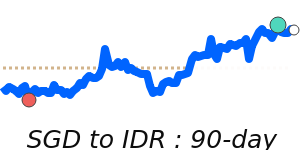
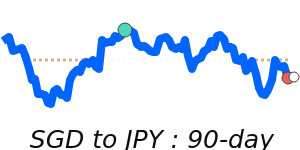
Meanwhile, the SGD has strengthened against the euro and the Canadian dollar, trading near multi-month highs. For example, the SGD to EUR is just 0.9% above its average, and the SGD to CAD is about 1.4% above its three-month level. The SGD has also reached near 60-day highs against the Australian dollar and multi-week peaks against the yen, indicating broad strength in the currency.
Investors are paying close attention to US dollar movements, which have been boosted by expectations of higher US interest rates. Such dynamics could influence the SGD’s future trajectory, especially if US rate hikes accelerate or if Singapore’s monetary policy shifts. Overall, expect the SGD to remain within existing ranges unless new policy signals emerge.
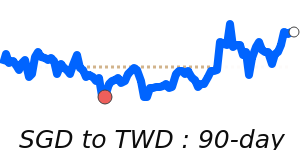
📊 Quick forecast view
🔴 Mild downside
0.7730 – 0.7890
⚖️ Interest-rate differentials
🟢 Uptrend