THB Market Update
27 Jun 2026 • 01:17 GMT
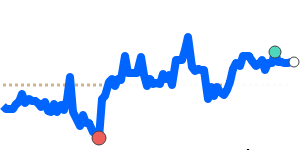
The Thai baht has been relatively stable lately, trading near its 90-day lows against the US dollar at around 0.02994. This is about 2.4% below its three-month average. The ongoing strength of the USD, driven by expectations of a possible Federal Reserve rate hike in September and concerns over global economic uncertainties, has kept the dollar firm.
Thailand’s monetary policy adjustments, including a rate cut in December 2025 and measures to control gold transactions, are also influencing currency movements. Despite these efforts, the baht is expected to weaken gradually against the dollar by the end of the year, with some forecasts suggesting a rate around 32 per USD.
Meanwhile, the baht remains stable against other major currencies like the euro, yen, and Australian dollar. These minor fluctuations reflect the broader impact of USD strength and domestic policies.
For retail FX traders, the key takeaway is to monitor USD movements closely, as ongoing geopolitical and economic developments could sway the baht’s direction. The currency continues to be influenced by global risk sentiment, alongside Thai domestic policies.