Switch .com Best Exchange Rates .com Best Exchange Rates .com Best Exchange Rates
BER

    Americas - - Key Exchange Rates

    Latest mid-market exchange rates with 90-day UP/DOWN trends and HIGH/LOW alerts for the most popular Americas cross rates. Keep track of when currency rates are in your favour.

    Stay informed with the latest exchange rates for key currencies across the Americas, including the United States Dollar (USD), Canadian Dollar (CAD), Mexican Peso (MXN), Brazilian Real (BRL), and others. Whether you're conducting international business, planning travel, or monitoring economic trends, our up-to-date information provides a comprehensive view of currency values throughout North, Central, and South America. Access real-time data and insights to make informed decisions for your currency exchange needs across the diverse economies of the Americas.

    Americas


    Australian dollar to US dollar
    AUDUSD 90 day chart

    AUD to USD is at 90-day highs near 0.6446, 2.3% above its 3-month average of 0.63, having traded in a fairly volatile 8.2% range from 0.5957 to 0.6446
    AUD to USD
    0.6446
    +1.0%
    90d-highs

    Canadian dollar to Brazilian real
    CAD to BRL at 4.0951 is just 0.7% above its 3-month average of 4.0671, having traded in a fairly volatile 9.2% range from 3.9430 to 4.3044
    CAD to BRL
    4.0951

    British pound to US dollar
    GBPUSD 90 day chart

    GBP to USD is at 7-day lows near 1.3271, 3.0% above its 3-month average of 1.2882, having traded in a fairly volatile 9.4% range from 1.2285 to 1.3443
    GBP to USD
    1.3273

    US dollar to Argentine peso
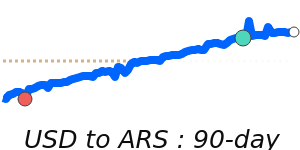
    USDARS 90 day chart

    USD to ARS at 1173 is 8.0% above its 3-month average of 1086, having traded in a rather volatile 14.0% range from 1051 to 1198
    USD to ARS
    1,172.8
    +0.1%

    US dollar to Bolivian boliviano
    USD to BOB is at 60-day highs near 6.9350, just above its 3-month average, having traded in a very stable 2.5% range from 6.8363 to 7.0088
    USD to BOB
    6.9326
    60d-highs

    US dollar to Brazilian real
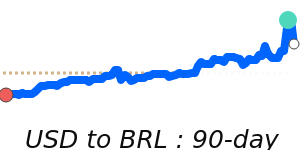
    USDBRL 90 day chart

    USD to BRL at 5.6597 is 2.0% below its 3-month average of 5.7754, having traded in a quite volatile 10.8% range from 5.6216 to 6.2304
    USD to BRL
    5.6597
    -0.2%

    US dollar to Belize dollar
    USD to BZD is at 60-day highs near 2.0153, just above its 3-month average, having traded in a very stable 2.5% range from 1.9873 to 2.0373
    USD to BZD
    2.0153
    60d-highs

    US dollar to Canadian dollar
    USDCAD 90 day chart

    USD to CAD at 1.3821 is 2.7% below its 3-month average of 1.4203, having traded in a relatively stable 6.6% range from 1.3799 to 1.4703
    USD to CAD
    1.3821
    -0.2%
    90d-lows

    US dollar to Chilean peso
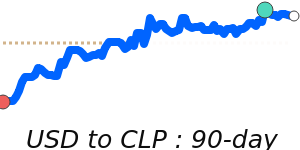
    USDCLP 90 day chart

    USD to CLP at 946.2 is just 0.5% below its 3-month average of 951.1, having traded in a fairly volatile 9.1% range from 917.2 to 1001
    USD to CLP
    946.15
    -0.2%

    US dollar to Colombian peso
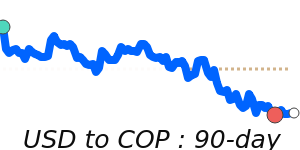
    USDCOP 90 day chart

    USD to COP is at 7-day highs near 4270, 2.1% above its 3-month average of 4183, having traded in a fairly volatile 9.4% range from 4072 to 4456
    USD to COP
    4,268.7
    +1.4%

    US dollar to Falkland Islands pound
    USD to FKP is at 7-day highs near 0.7536, 3.0% below its 3-month average of 0.7767, having traded in a fairly volatile 9.4% range from 0.7439 to 0.8140
    USD to FKP
    0.7534

    US dollar to Guatemalan quetzal
    USD to GTQ is at 14-day highs near 7.7039, near its 3-month average, having traded in a very stable 2.8% range from 7.6326 to 7.8456
    USD to GTQ
    7.7039
    14d-highs

    US dollar to Guyanaese dollar
    USD to GYD at 209.3 is near its 3-month average, having traded in a very stable 2.5% range from 207.0 to 212.2
    USD to GYD
    209.26

    US dollar to Honduran lempira
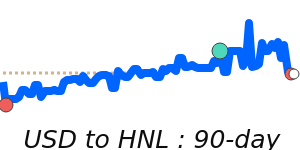
    USDHNL 90 day chart

    USD to HNL is at 90-day highs near 26.03, 1.3% above its 3-month average of 25.7, having traded in a very stable 2.8% range from 25.31 to 26.03
    USD to HNL
    26.03
    90d-highs

    US dollar to Haitian gourde
    USD to HTG is at 30-day highs near 131.0, near its 3-month average, having traded in a stable 1.5% range from 129.7 to 131.6
    USD to HTG
    131.04
    30d-highs

    US dollar to Jamaican dollar
    USD to JMD is at 60-day highs near 158.8, just 0.8% above its 3-month average of 157.6, having traded in a very stable 2.9% range from 155.5 to 160.0
    USD to JMD
    158.83
    60d-highs

    US dollar to Japanese yen
    USDJPY 90 day chart

    USD to JPY at 144.9 is 2.2% below its 3-month average of 148.2, having traded in a quite volatile 10.1% range from 140.9 to 155.2
    USD to JPY
    144.90
    -0.3%

    US dollar to Mexican peso
    USDMXN 90 day chart

    USD to MXN at 19.58 is 3.1% below its 3-month average of 20.21, having traded in a fairly volatile 8.7% range from 19.50 to 21.20
    USD to MXN
    19.58
    -0.1%

    US dollar to Peruvian nuevo sol
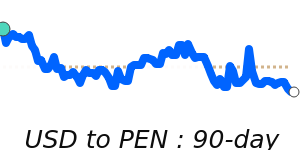
    USDPEN 90 day chart

    USD to PEN at 3.6776 is just below its 3-month average, having traded in a quite stable 4.4% range from 3.6156 to 3.7731
    USD to PEN
    3.6776
    14d-lows

    US dollar to Paraguayan guarani
    USD to PYG is at 14-day highs near 8033, just 1.0% above its 3-month average of 7955, having traded in a very stable 2.7% range from 7856 to 8067
    USD to PYG
    8,033.5
    14d-highs

    US dollar to Surinnse dollar
    USD to SRD is at 7-day lows near 36.85, 2.1% above its 3-month average of 36.09, having traded in a quite stable 6.0% range from 35.10 to 37.21
    USD to SRD
    36.85

    US dollar to Trinidad and Tobago dollar
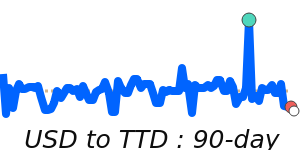
    USDTTD 90 day chart

    USD to TTD is at 14-day highs near 6.7929, near its 3-month average, having traded in a very stable 2.5% range from 6.7132 to 6.8798
    USD to TTD
    6.7929
    14d-highs

    US dollar to Uruguayan peso
    USD to UYU at 41.96 is 1.5% below its 3-month average of 42.6, having traded in a quite stable 4.1% range from 41.83 to 43.53
    USD to UYU
    41.96

    View a full list of exchange rates by selecting your Base (from) currency: