GBP Market Update
27 Jun 2026 • 01:10 GMT
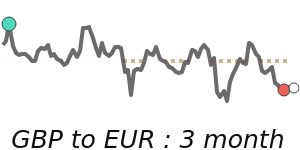
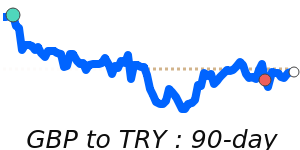
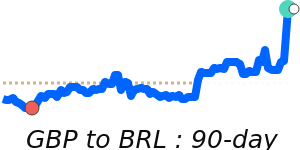
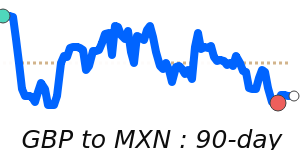
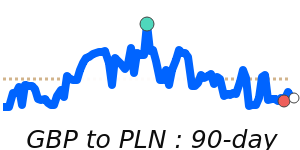
The British pound remains relatively stable around 1.32 against the US dollar, which is about 1.6% below its three-month average of 1.34. Despite ongoing political uncertainty in the UK, the currency has held steady within a narrow 3.5% trading range. Market participants are keeping an eye on potential UK fiscal policy developments and upcoming political events, which could influence GBP’s trajectory.
Meanwhile, the dollar continues to gain strength amid global risk concerns, driven by expectations of an interest rate hike from the Federal Reserve later this year. This has kept USD sentiment firm, supporting a generally cautious tone for the pound and other risk-sensitive currencies.
Looking ahead, forecasts from major banks suggest GBP/USD could reach around 1.36 to 1.39 by year's end, indicating a modest upward bias in the medium term. However, any sudden shifts in US monetary policy or UK political stability could alter this outlook.
Overall, the pound remains resilient in a volatile environment, trading within its typical range, with traders remaining attentive to political and economic signals that could influence its direction.
📊 Quick forecast view
🔴 Mild downside
1.2940 – 1.3200
🌍 Global risk sentiment
🟢 Uptrend