Switch .com Best Exchange Rates .com Best Exchange Rates .com Best Exchange Rates
BER

    Europe - Key Exchange Rates

    Latest mid-market exchange rates with 90-day UP/DOWN trends and HIGH/LOW alerts for the most popular European cross rates. Keep track of when currency rates are in your favour.

    Stay informed with the latest exchange rates for key European currencies. Whether you're planning a trip, managing international payments, or tracking market trends, our comprehensive guide provides real-time updates on the Euro (EUR), British Pound (GBP), Swiss Franc (CHF), and other major currencies. With accurate data and insights into market fluctuations, we help you make smarter financial decisions. Check out the best rates for your exchange needs and optimize your currency transactions today.

    Europe


    Euro to British pound
    EURGBP 90 day chart

    EUR to GBP at 0.8516 is 1.2% above its 3-month average of 0.8416, having traded in a quite stable 5.3% range from 0.8246 to 0.8683
    EUR to GBP
    0.8516
    +0.2%

    Euro to US dollar
    EURUSD 90 day chart

    EUR to USD at 1.1303 is 4.2% above its 3-month average of 1.0844, having traded in a rather volatile 12.5% range from 1.0230 to 1.1513
    EUR to USD
    1.1303
    +0.1%

    British pound to Australian dollar
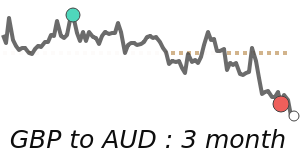
    GBPAUD 90 day chart

    GBP to AUD is at 30-day lows near 2.0588, just 0.7% above its 3-month average of 2.0448, having traded in a fairly volatile 8.8% range from 1.9696 to 2.1430
    GBP to AUD
    2.0591
    -1.0%
    30d-lows

    British pound to Canadian dollar
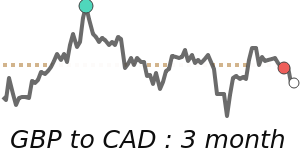
    GBPCAD 90 day chart

    GBP to CAD is at 14-day lows near 1.8340, just above its 3-month average, having traded in a quite stable 5.7% range from 1.7696 to 1.8701
    GBP to CAD
    1.8344
    -0.3%
    14d-lows

    British pound to New Zealand dollar
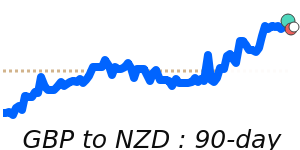
    GBPNZD 90 day chart

    GBP to NZD is at 7-day lows near 2.2300, just below its 3-month average, having traded in a quite stable 5.4% range from 2.1892 to 2.3066
    GBP to NZD
    2.2300
    -0.8%

    British pound to US dollar
    GBPUSD 90 day chart

    GBP to USD is at 7-day lows near 1.3271, 3.0% above its 3-month average of 1.2882, having traded in a fairly volatile 9.4% range from 1.2285 to 1.3443
    GBP to USD
    1.3273

    US dollar to Swiss franc
    USDCHF 90 day chart

    USD to CHF at 0.8266 is 5.2% below its 3-month average of 0.8715, having traded in a rather volatile 13.2% range from 0.8092 to 0.9161
    USD to CHF
    0.8266
    -0.3%

    US dollar to Czech Republic horuna
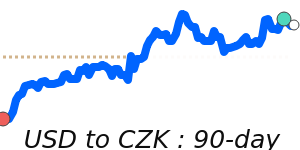
    USDCZK 90 day chart

    USD to CZK at 22.05 is 4.6% below its 3-month average of 23.12, having traded in a rather volatile 13.3% range from 21.74 to 24.63
    USD to CZK
    22.05
    -0.1%

    US dollar to Danish krone
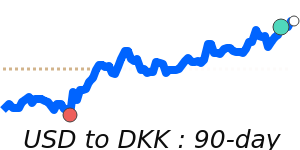
    USDDKK 90 day chart

    USD to DKK at 6.6043 is 4.2% below its 3-month average of 6.8903, having traded in a rather volatile 12.5% range from 6.4849 to 7.2934
    USD to DKK
    6.6043
    -0.1%

    US dollar to Hungarian forint
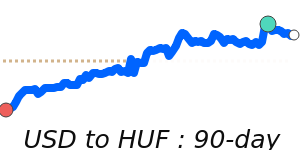
    USDHUF 90 day chart

    USD to HUF at 358.1 is 3.9% below its 3-month average of 372.5, having traded in a rather volatile 12.9% range from 353.7 to 399.5
    USD to HUF
    358.06
    -0.1%

    US dollar to Norwegian krone
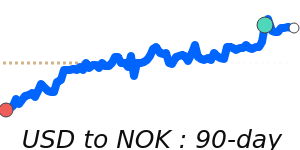
    USDNOK 90 day chart

    USD to NOK at 10.41 is 3.6% below its 3-month average of 10.8, having traded in a quite volatile 11.2% range from 10.33 to 11.49
    USD to NOK
    10.41
    -0.2%

    US dollar to Polish zloty
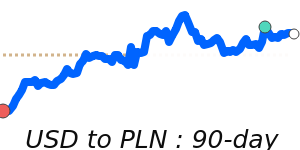
    USDPLN 90 day chart

    USD to PLN at 3.7853 is 2.6% below its 3-month average of 3.8866, having traded in a very volatile 16.4% range from 3.5425 to 4.1232
    USD to PLN
    3.7853
    -0.2%

    US dollar to Russian ruble
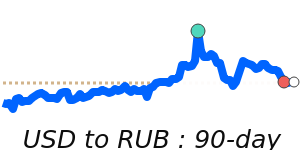
    USDRUB 90 day chart

    USD to RUB is at 7-day highs near 82.75, 5.1% below its 3-month average of 87.16, having traded in a very volatile 24.1% range from 81.16 to 100.7
    USD to RUB
    82.75
    +0.9%

    US dollar to Swedish krona
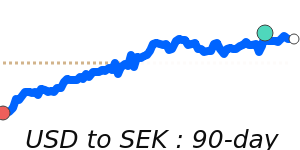
    USDSEK 90 day chart

    USD to SEK at 9.6547 is 5.5% below its 3-month average of 10.22, having traded in a very volatile 18.1% range from 9.5267 to 11.25
    USD to SEK
    9.6547
    -0.9%
    14d-highs

    US dollar to Turkish lira
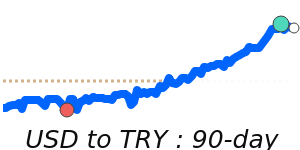
    USDTRY 90 day chart

    USD to TRY is at 90-day highs near 38.58, 3.7% above its 3-month average of 37.21, having traded in a fairly volatile 8.1% range from 35.70 to 38.58
    USD to TRY
    38.58
    +0.3%
    90d-highs

    View a full list of exchange rates by selecting your Base (from) currency: