Outlook
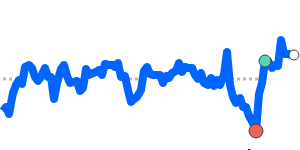
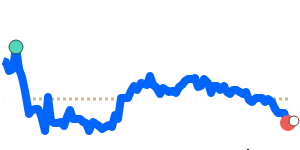
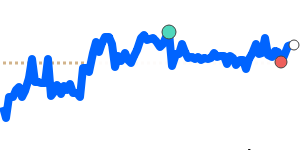
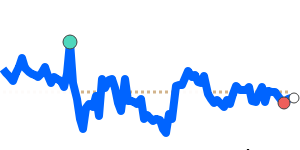
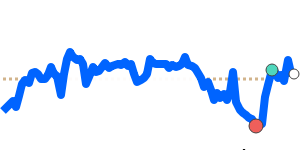
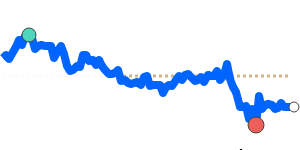
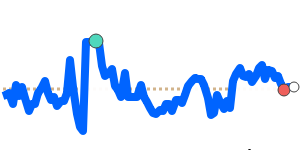
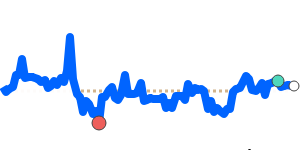
Thai baht remains sensitive to policy moves and inflows. The Bank of Thailand has intervened to slow currency movements as the baht tests four-year highs, and new online gold trading regulations take effect in March 2026 to curb volatility. Exporters warn that a persistently strong baht hurts competitiveness, while tourism-related and legitimate inflows could support modest strength if risk sentiment remains stable. Current indicative levels show THB trading around 0.032 per USD, with the 3-month average near 0.03166 and a 5.4% trading range from 0.03079 to 0.03246. THB also sits near its 3-month average against EUR (0.02709) and GBP (0.02361), with modest ranges around those levels. Against JPY, THB is around 4.93 per THB, near seven-day lows, within a roughly 7.1% range from 4.7607 to 5.1007.
Key drivers
- Bank of Thailand interventions to slow rapid currency movements, following a period of strength in the baht.
- Regulatory tightening on online gold trading, effective March 2026, aimed at reducing volatility and increasing transparency in flows.
- Reports of illicit funds flowing into Thailand via digital assets, gold, and other assets, prompting government tracing measures that could affect currency dynamics and tourism.
- Exporters’ concerns that a stronger baht reduces competitiveness, potentially shaping policy responses or market expectations.
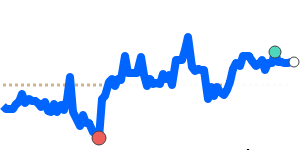
- Recent price data showing THB near or slightly above its 3-month averages across major peers, with limited volatility within established ranges.
Range
THB/USD 0.032165; 3-month avg 0.031657; 5.4% range from 0.030788 to 0.032456
THB/EUR 0.027086; 3-month avg not specified here; 3.8% range from 0.026511 to 0.027522
THB/GBP 0.023612; 3-month avg not specified here; 4.0% range from 0.023049 to 0.023982
THB/JPY around 4.9296 per THB; 7-day low; 7.1% range from 4.7607 to 5.1007
What could change it
- Further BoT policy moves or unexpected interventions that alter the pace of balance of payments-driven moves.
- The March 2026 rollout of online gold trading regulations, which could modify capital/inflow behavior.
- Shifts in illicit funds controls and enforcement that affect currency demand and tourism sentiment.
- Changes in global risk appetite or USD strength that influence currency cross flows and the baht’s relative attractiveness.
- Developments in export demand, tourism recovery, or commodity prices that alter the baht’s trade-off between growth and inflation.