USD Market Update
18 Jul 2026 • 01:09 GMT
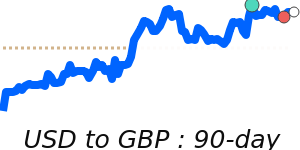
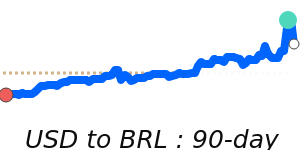
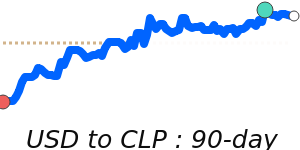
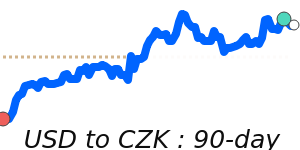
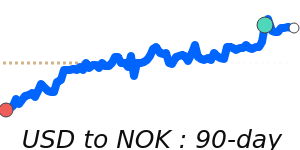
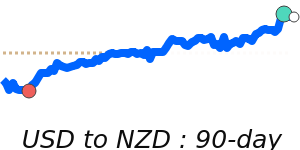
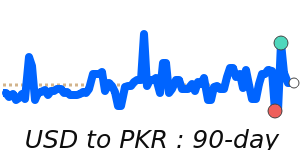
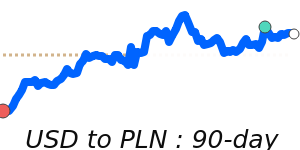
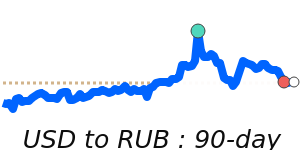
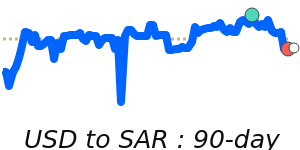
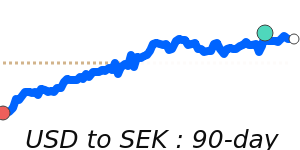
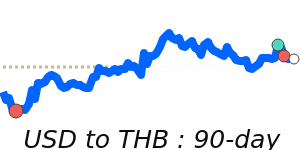
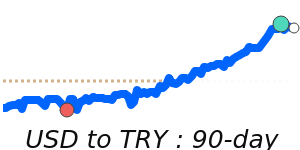
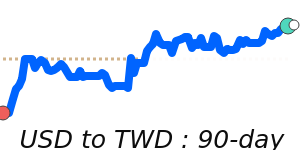
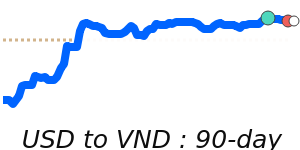
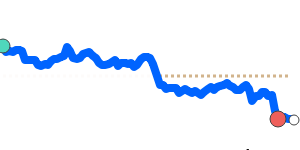
The US dollar remains supported by rising energy prices and ongoing geopolitical tensions in the Gulf, which have bolstered market confidence in the dollar's strength. Against the euro, USD is currently trading at around 0.8741, slightly above its three-month average, after moving within a stable range. The dollar also remains firm against commodity-linked currencies like the AUD and CHF, while recently reaching near 7-day highs versus the JPY at 162.5. Conversely, the USD has softened slightly against the CAD, trading near 1.4021, close to its recent 30-day lows. Traders should keep an eye on energy market developments and geopolitical events, as these factors could continue to push the dollar higher or provide moments of relief. Market participants are also awaiting upcoming US CPI data, which could influence Federal Reserve policy directions and, in turn, impact the dollar's overall strength. With broad stability in most major pairs, the dollar's trajectory will largely depend on energy trends and geopolitical stability in the near term.
📊 Quick forecast view
🔴 Mild downside
0.8650 – 0.8800
🌍 Global risk sentiment
⚪ Range-bound