Outlook
The rand remains supported by firm global commodity demand and a relatively contained USD, aided by domestic policy progress. If these trends persist, the ZAR could hold ground against major currencies. However, shifts in global risk sentiment or a stronger dollar could cap gains.
Markets point to continued strength from commodity prices and the domestic policy trajectory, but near-term volatility is likely as global finance conditions evolve. Sources: pwharvey.co.za and ebnet.co.za.
Key drivers
- Global commodity prices: Strong demand for gold, platinum, iron ore, and coal boosts South Africa’s export earnings and supports the rand.
- Monetary policy adjustments: The SARB has kept high interest rates to curb inflation, while the US Federal Reserve’s dovish tilt has tended to soften dollar strength, helping the rand.
- Fiscal policy developments: Deficit reduction and efforts to improve public sector efficiency bolster investor confidence.
- Political stability: The formation of a centrist Government of National Unity has alleviated investor concerns and supported rand resilience.
Range
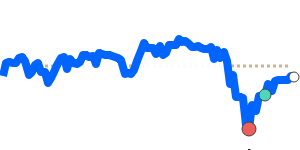
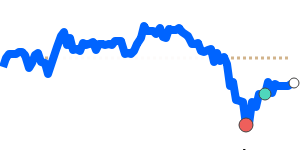
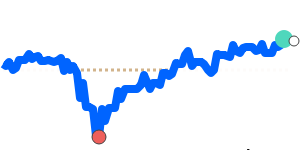
ZARUSD is at 0.062720, 4.2% above its 3-month average of 0.060203, having traded in a volatile 10.6% range from 0.057471 to 0.063546.
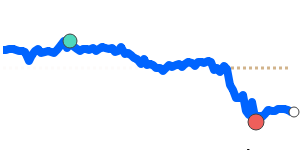
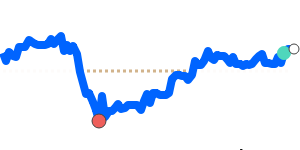
ZAREUR is at 0.052759, 2.6% above its 3-month average of 0.051411, with a range of 0.049907 to 0.053110 (6.4% range).
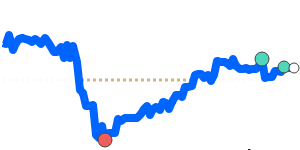
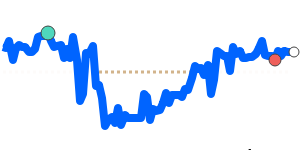
ZARGBP is at 0.046003, about 2.5% above its 3-month average of 0.04486, trading within a 4.9% range from 0.043864 to 0.046031 (7-day highs near current level).
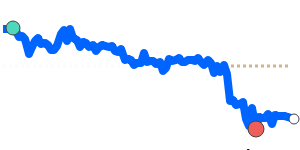
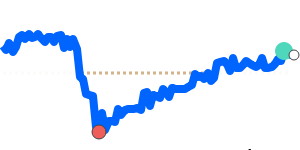
ZARJPY is at 9.6865, 3.0% above its 3-month average of 9.4052, with a 9.2% range from 8.9987 to 9.8247.
What could change it
- Global commodity price shifts: Any sustained rally or drop in key exports could extend or trim rand strength.
- Monetary policy trajectory: A surprise move by the SARB or a renewed hawkish shift by the Fed could alter rate differentials and USD direction.
- Fiscal outcomes: Further progress or setbacks in deficit reduction and public sector reform could influence investor sentiment.
- Political and global risk sentiment: Developments around political stability or global risk-on/risk-off cycles can sway flows into and out of the rand.