ZAR Market Update
27 Jun 2026 • 01:15 GMT
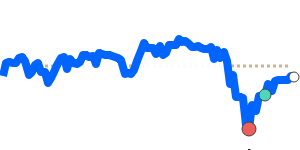
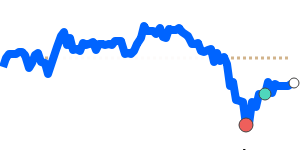
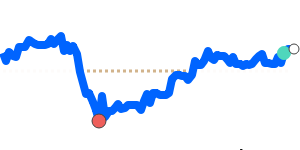
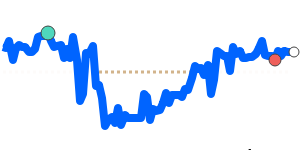
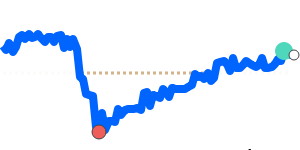
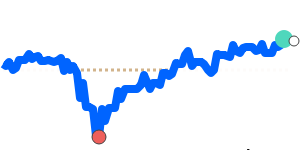
The South African rand has weakened slightly against the US dollar, moving closer to 60-day lows at around 0.05888. This decline comes amid the USD's recent rally, driven by strong US interest rate expectations and ongoing market concerns. The USD continues to benefit from investor focus on possible rate hikes by the Federal Reserve, as well as global uncertainties that make the greenback a safe haven.
While the rand remains below its three-month average, it’s still relatively stable overall, trading within a narrow range. The economic outlook in South Africa remains cautiously optimistic, with forecasts for modest growth and lower inflation targeted by the South African Reserve Bank. This, combined with stable commodity prices, has helped limit abrupt movements in the rand.
Looking ahead, if US interest rate hike expectations intensify or geopolitical tensions increase, the dollar could gain further strength, pressuring the rand. Conversely, positive economic data and improving local conditions in South Africa might support a return to stronger rand levels. As always, traders should keep a close eye on global risk sentiment and any updates from the US Federal Reserve.
📊 Quick forecast view
🟢 Mild upside
0.0580 – 0.0590
🌍 Global risk sentiment
🟢 Uptrend