AUD Market Update
27 Jun 2026 • 01:11 GMT
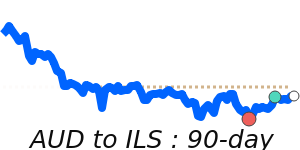
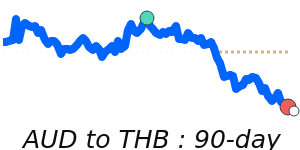
The Australian dollar has fallen to its lowest levels in around 60 days against several major currencies, including the US dollar, euro, and British pound. The AUD/USD has dipped to about 0.6896, which is roughly 2.7% below its three-month average of 0.7089, trading within a relatively narrow range from 0.6853 to 0.7258. This move reflects market uncertainty ahead of the upcoming Australian jobs report, which traders see as a key indicator for future RBA policy direction.
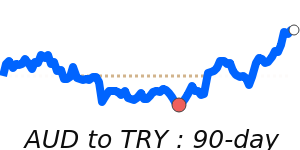
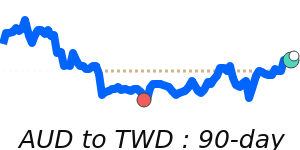
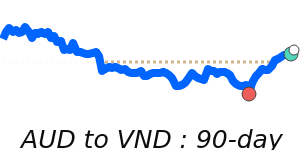
Meanwhile, the AUD has also weakened against the euro, trading near 0.6053, and against the pound, at approximately 0.5224. Both pairs are near their 60-day lows, with stability seen in recent trading ranges. These declines are partly due to the broader strength in the US dollar, which has gained momentum amid increasing investor expectations of a Federal Reserve rate hike later this year. As a result, the AUD’s near-term outlook remains cautious, with some analysts expecting modest recovery if Australian employment data surprises positively. However, ongoing global economic uncertainties and the USD’s safe-haven appeal continue to weigh on the Australian dollar.
📊 Quick forecast view
🔴 Mild downside
0.6730 – 0.6900
🌍 Global risk sentiment
🔴 Downtrend