CAD Market Update
29 Jun 2026 • 00:27 GMT
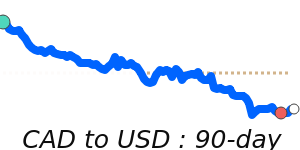
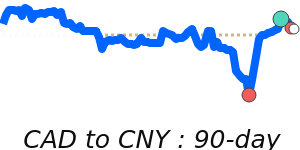
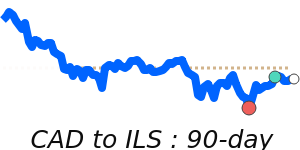
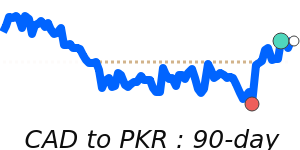
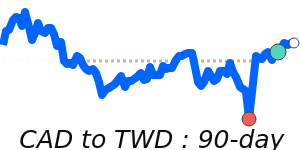
The Canadian dollar remains on the softer side against the US dollar, trading at around 0.7046. This level is about 2.4% below its three-month average of 0.7222, and it has stayed within a relatively narrow range from 0.7026 to 0.7363. The weaker CAD reflects ongoing US dollar strength, driven by expectations of higher US interest rates and solid economic data. Meanwhile, the US dollar has been close to its yearly high, with traders watching upcoming US economic reports and potential Fed rate hikes.
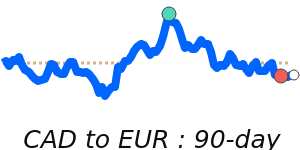
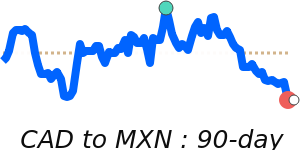
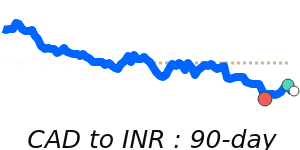
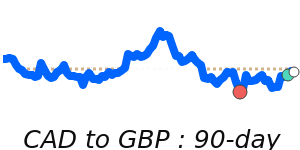
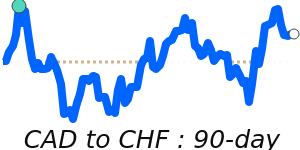
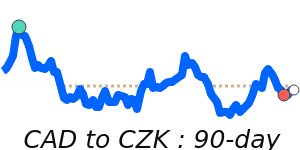
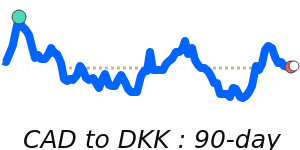
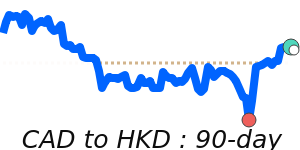
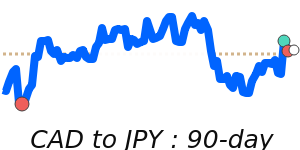
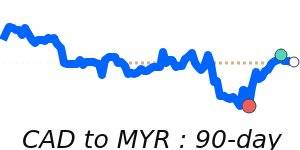
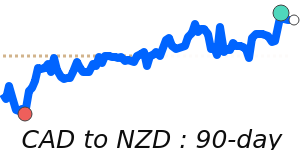
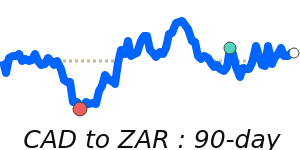
In contrast, the CAD has held steady against other major currencies. It is close to its 14-day highs versus the Australian dollar and Swiss franc, and only slightly below its average against the euro and British pound. Oil prices, which are crucial for Canada's economy, have yet to significantly support the CAD, especially with some recent declines. Geopolitical tensions and US monetary policy developments remain key factors that could influence currency moves in the coming weeks. Overall, while the Canadian dollar shows signs of stability, its performance largely tracks the strength of the US dollar amid global economic uncertainties.
📊 Quick forecast view
🔴 Mild downside
0.6900 – 0.7050
🌍 Global risk sentiment
⚪ Range-bound