CAD Market Update
27 Jun 2026 • 01:11 GMT
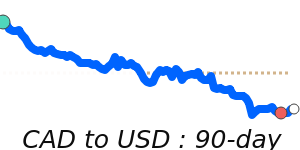
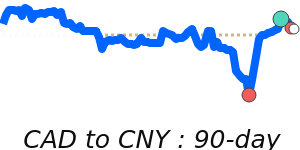
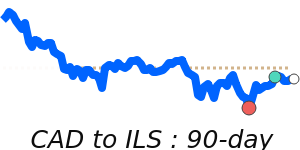
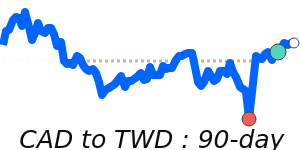
The Canadian dollar remains under pressure against major currencies, falling about 2.5% below its three-month average versus the US dollar. This weakness is driven by diverging yields between the U.S. and Canada, along with weaker oil prices, which are key for Canada's economy. The USD/CAD pair has traded in a relatively narrow range but continues to show signs of further downside. While some technical metrics suggest the pair may be overbought, the overall momentum favors a weaker loonie if U.S. interest rate expectations and oil prices stay supportive of the dollar.
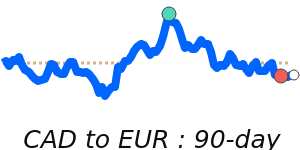
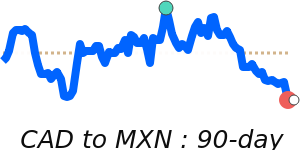
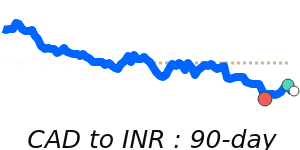
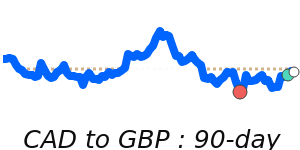
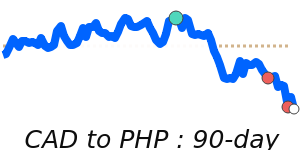
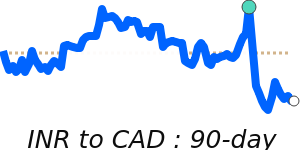
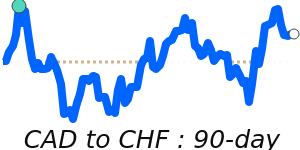
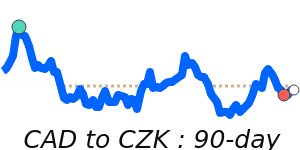
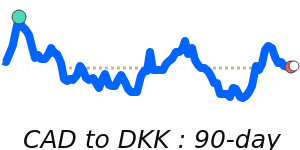
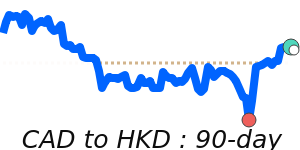
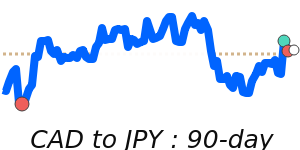
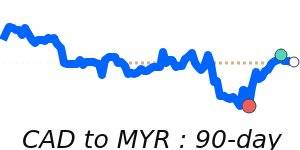
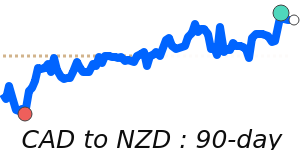
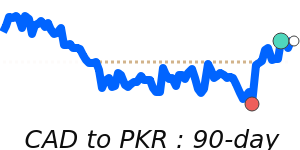
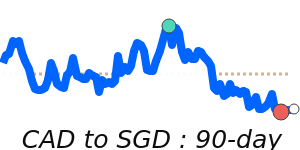
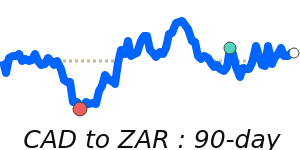
Against other currencies, the CAD remains stable near recent highs against the Australian dollar and Swiss franc, with only slight deviations from recent averages. The CAD’s move against the euro and GBP is modest, remaining within tight ranges and just below their three-month averages. Meanwhile, against the Japanese yen and Indian rupee, the CAD has traded close to recent lows, reflecting ongoing global risk concerns and commodity influences.
Market participants should keep an eye on U.S. interest rate expectations and oil markets, as these are key drivers for the CAD’s near-term direction. Any shifts in risk sentiment or in energy prices could trigger more sizable moves in the Canadian dollar.
📊 Quick forecast view
🔴 Mild downside
0.6900 – 0.7050
🌍 Global risk sentiment
⚪ Range-bound