CAD Market Update
22 Jul 2026 • 00:28 GMT
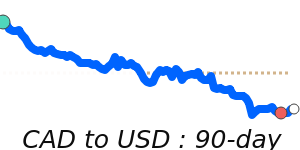
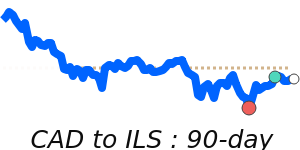
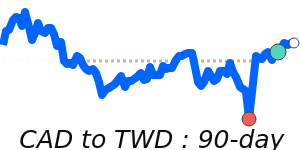
The Canadian dollar is currently at its 7-day low against the US dollar, trading near 0.7088, which is about 1.3% below its three-month average of 0.7183. Over recent days, CAD/USD has been quite steady within a 4.8% range, demonstrating limited sharp moves. The ongoing strength of the US dollar is supported by a cautious market mood, driven by geopolitical concerns and safe-haven flows, especially amid tensions in the Middle East and rising oil prices.
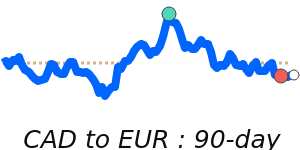
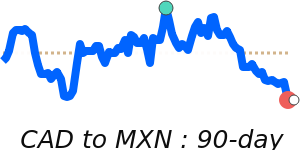
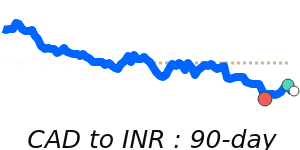
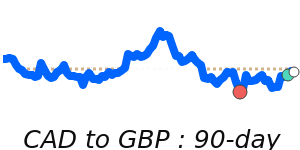
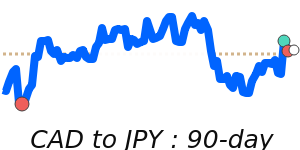
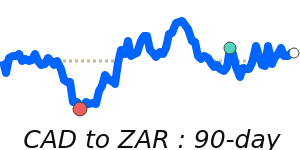
While the Canadian dollar has softened against the US dollar, it remains relatively stable against other major currencies like the euro and the Japanese yen. The CAD is trading close to its three-month average versus the EUR and only slightly below its 3-month average against the JPY. The overall tone suggests limited volatility so far, but traders are keeping an eye on US and Canadian economic data, as well as potential shifts in oil prices.
Looking ahead, the Canadian dollar’s direction will likely depend on US dollar trends, oil market movements, and any new developments in trade relations or monetary policy. Keep monitoring key economic indicators and geopolitical news for clues on future currency moves.
📊 Quick forecast view
🔴 Mild downside
0.6900 – 1.3400
🌍 Global risk sentiment
⚪ Range-bound