EUR Market Update
27 Jun 2026 • 01:10 GMT
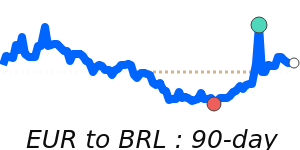
The euro remains relatively stable but has struggled against the strength of the US dollar. Currently, EUR/USD is at around 1.1392, which is about 2% below its three-month average of 1.1623. The pair has traded within a narrow 3.9% range from 1.1359 to 1.1799, reflecting limited recent volatility. Despite a rate hike by the European Central Bank to 2.25%, the euro faces pressure due to sluggish growth in the Eurozone and the dollar’s bullish momentum driven by rising interest rate expectations in the US.
The US dollar continues to strengthen amid global uncertainties and investor concerns over AI developments, making it a safe haven asset. Market focus is on upcoming Federal Reserve signals, which could influence dollar strength further. Conversely, the euro’s outlook may improve if economic data in the Eurozone shows signs of growth or if US rate hike expectations ease.
In the near term, traders should monitor geopolitical developments affecting energy and trade, as well as central bank communications. Overall, the euro is in a steady range but faces headwinds against a stronger USD, with a possible shift if economic conditions or policy signals change.
📊 Quick forecast view
🔴 Mild downside
1.1390 – 1.1620
🌍 Global risk sentiment
🟢 Uptrend