GBP Market Update
22 Jul 2026 • 00:27 GMT
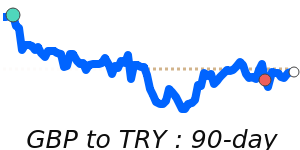
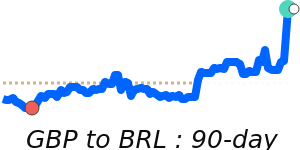
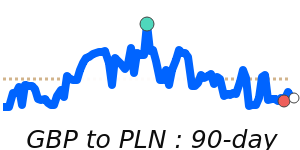
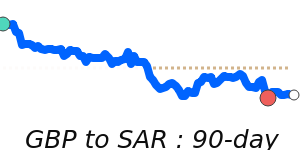
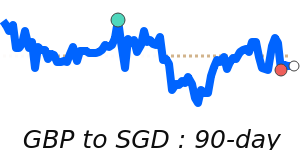
The British pound has recently dipped against the US dollar, reaching lows near 1.3360, as the US currency gains strength amid ongoing geopolitical tensions. Investors are seeking safety with the dollar, which has shown resilience despite a mixed global economic picture. The GBP is also slightly below its 3-month average against the dollar, within a stable trading range.
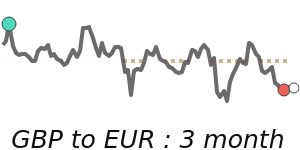
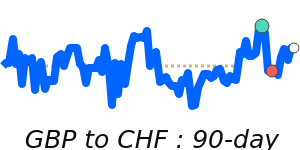
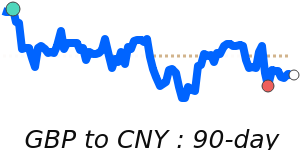
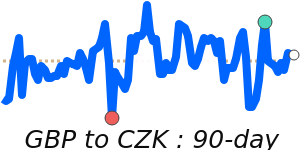
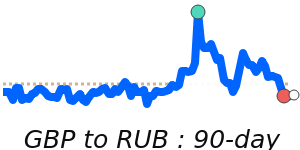
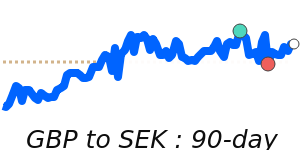
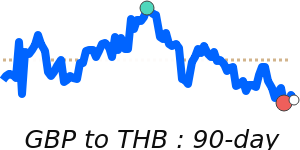
Looking ahead, market focus remains on key economic data releases and any developments related to the Middle East, which could influence GBP/USD movement. Meanwhile, the Bank of England's signals on raising interest rates keep some support for the pound, but political uncertainties and rising UK government bond yields add to the complex backdrop. The GBP remains relatively steady against other major currencies, trading near 1.1733 versus the euro and around 218.3 against the yen.
In the near term, traders will watch for signs of a turnaround or further declines in the pound, depending on how geopolitical risks and UK economic data play out. Overall, the GBP continues to navigate a cautious environment, with volatility likely to persist.
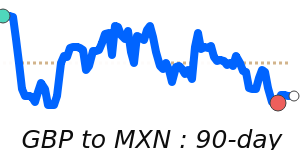
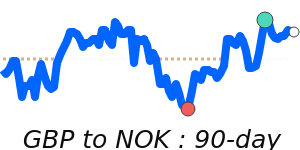
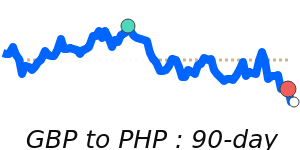
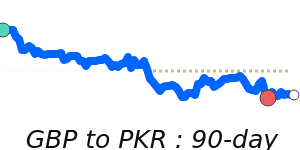
📊 Quick forecast view
🔴 Mild downside
1.2940 – 1.3380
🌍 Global risk sentiment
⚪ Range-bound