MXN Market Update
27 Jun 2026 • 01:15 GMT
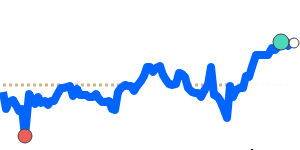
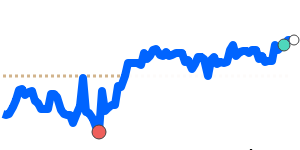
The Mexican Peso (MXN) has remained relatively calm against the US dollar, now trading close to its three-month average of 0.057431. Currently, MXN/USD is at about 0.057129, just 0.5% below this average. The peso has been within a stable range, fluctuating between 0.055179 and 0.058231, suggesting limited recent volatility.
The broader dollar strength continues to be a key factor, as market uncertainties like US interest rate prospects and global economic concerns keep the USD buoyant. While Banxico has paused its rate hikes at 6.50%, market watchers will be paying close attention to upcoming signals from the central bank, which could influence the peso’s direction.
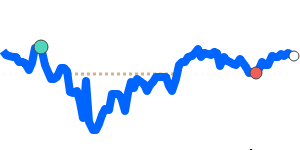
In other currency pairs, the peso has shown slight gains against the euro, GBP, and JPY, trading around or just above 1.5% of their three-month averages, reflecting a stable environment overall. Despite some regional pressures, the peso remains resilient with limited sharp movements in recent trading sessions. Traders should stay alert to global risk sentiment, US monetary policy updates, and Mexican economic data, which could all impact the peso in the near term.
📊 Quick forecast view
🟢 Mild upside
0.0570 – 0.0580
🌍 Global risk sentiment
⚪ Range-bound