MYR Market Update
27 Jun 2026 • 01:17 GMT
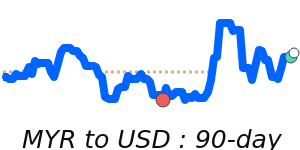
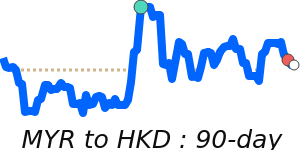
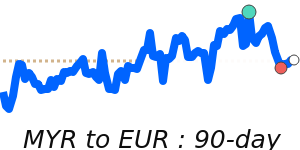
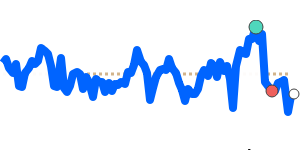
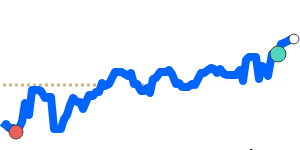
The Malaysian Ringgit (MYR) remains relatively stable against the US dollar, with the currency trading near 7-day highs around 0.2446. This position is slightly below its 3-month average of 0.2502, showing some resilience amid the broader strengthening of the USD. The recent rally in the dollar is driven by increasing expectations of a Federal Reserve rate hike later this year, supported by recent economic data and global market uncertainties.
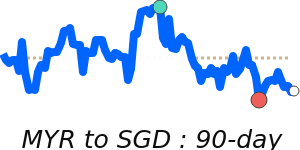
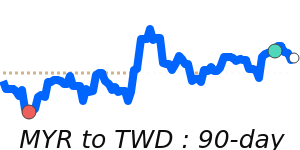
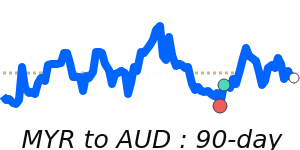
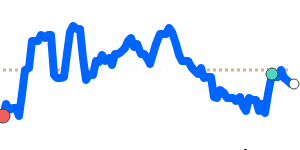
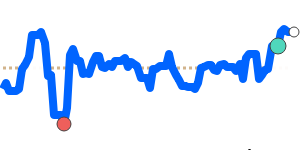
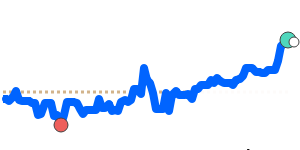
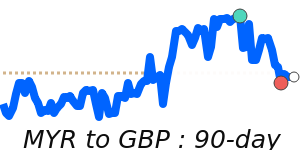
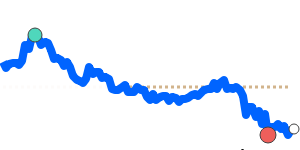
While the MYR has strengthened against several major currencies like the GBP and JPY, its gains are modest compared to the dollar's broader strength. The outlook remains cautiously optimistic, supported by Malaysia’s resilient economic fundamentals, steady foreign investment, and positive government policies.
Traders should watch for any shifts in US monetary policy or geopolitical developments that could impact US dollar movements. For now, the MYR continues to maintain a stable trading range, supported by Malaysia’s solid macroeconomic outlook and ongoing foreign investment inflows.
📊 Quick forecast view
🔴 Mild downside
0.2450 – 0.2560
🌍 Global risk sentiment
⚪ Range-bound