NOK Market Update
02 Jul 2026 • 00:30 GMT
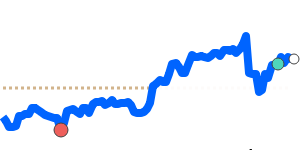
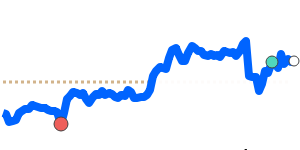
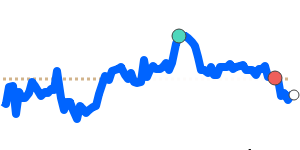
The Norwegian Krone (NOK) has seen a mixed performance against major currencies recently. Against the US dollar, NOK is trading at about 0.1009, which is roughly 4.6% below its three-month average. This reflects some recent volatility, with the NOK touching lows near 0.1007 and highs around 0.1090. The sharp move downward coincides with the US dollar’s broader strength, driven by expectations of a Federal Reserve interest rate hike later this year. As US rates look set to rise, the dollar remains firm, putting pressure on NOK/USD.
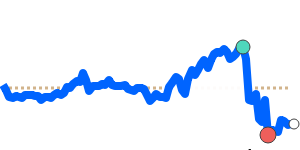
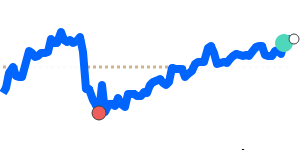
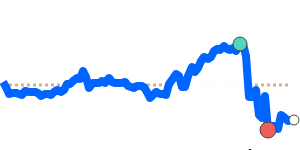
Meanwhile, the NOK has softened modestly against the euro, trading at about 0.088660, which is about 2.6% below its recent three-month average. The currency remains in a relatively stable range but could be influenced by energy price movements and Norges Bank policy signals.
Overall, while NOK has shown resilience due to Norges Bank’s potential upcoming rate hikes and energy market factors, the ongoing strength of the dollar points to continued volatility. Traders should keep an eye on US economic data and Norges Bank policy updates for further guidance.
📊 Quick forecast view
🔴 Mild downside
0.0990 – 0.1010
🌍 Global risk sentiment
⚪ Range-bound