NZD Market Update
22 Jul 2026 • 00:28 GMT
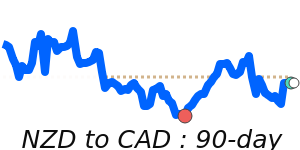
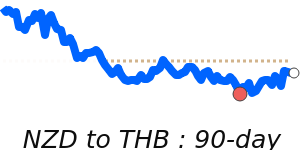
The New Zealand Dollar (NZD) remains relatively steady, trading close to its three-month average of around 0.5826 against the US Dollar. Recent support has come from the RBNZ’s aggressive rate hikes and solid New Zealand economic data, including strong manufacturing figures. This has helped keep the NZD resilient despite some caution around global risks.
Looking ahead, traders should monitor upcoming local economic reports and RBNZ guidance, which could influence currency moves further. While the NZD continues to trade within a stable range, its outlook remains optimistic if the current policy stance persists.
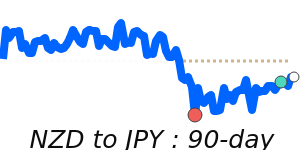
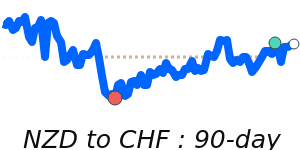
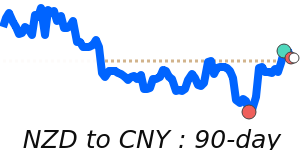
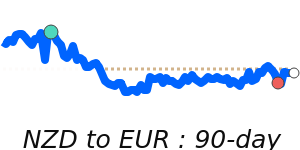
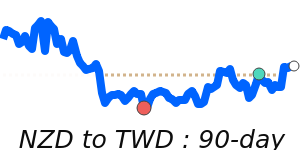
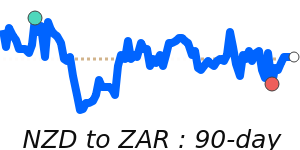
In the broader currency space, the USD has struggled to push higher amid geopolitical tensions, particularly in the Middle East, which has kept safe-haven demand elevated but limited the dollar's gains. The NZD has also seen notable strength against the euro and the Japanese yen, reaching 30-day highs near 0.511 and 95.09 respectively. Meanwhile, the NZD has softened slightly against the Australian dollar, trading near 0.8321. Overall, the Kiwi’s outlook appears supported by domestic monetary policy, but external risks and global economic developments will continue to influence its direction.
📊 Quick forecast view
🔴 Mild downside
0.5830 – 0.5990
🌍 Global risk sentiment
⚪ Range-bound