USD Market Update
27 Jun 2026 • 01:09 GMT
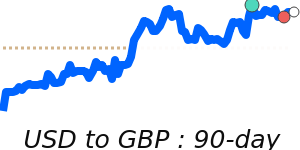
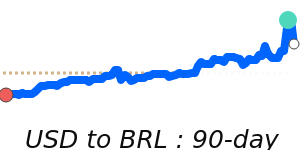
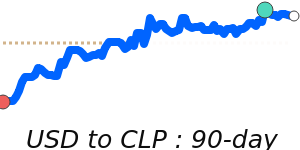
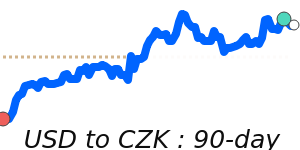
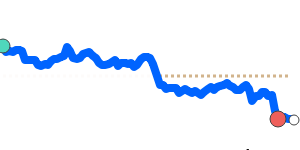
The US dollar has strengthened against several major currencies recently, driven by investors seeking safety amid global uncertainties. Notably, the USD is trading at around 0.8778 against the euro, which is about 2% above its three-month average of 0.8604. This spike reflects renewed expectations of a Federal Reserve interest rate hike, as market participants anticipate tighter U.S. monetary policy. Meanwhile, the USD has gained against the yen, reaching near 161.8, its highest in 90 days, supported by strong U.S. economic signals and risk appetite shifts. The dollar also remains firm against the Canadian dollar and the Australian dollar, trading at around 1.4195 and 1.4501 respectively, both above their recent averages. These moves highlight the dollar’s current status as a preferred safe haven amid geopolitical tensions and economic data that point toward resilience in the U.S. economy. Traders should keep an eye on upcoming Fed communications and global geopolitical developments, which could influence the dollar’s trajectory in the coming weeks.
📊 Quick forecast view
🔴 Mild downside
0.8650 – 0.8800
🛡️ Safe-haven flows
🔴 Downtrend