Recent developments in the Swiss franc (CHF) are notable for small businesses, expatriates, and travelers engaging in international transactions. The currency's performance is shaped by a combination of Swiss National Bank (SNB) policies, inflation trends, and export challenges, alongside broader economic forecasts.
Firstly, the SNB has adopted a notably aggressive approach to monetary policy. In December 2024, the Bank issued its fourth consecutive rate cut, lowering the key policy rate by 50 basis points to 0.5%. This was largely a response to easing inflation and the ongoing strength of the CHF. Such reductions in interest rates typically encourage spending and investment by making borrowing cheaper. However, they also reflect a cautious approach to managing currency strength, which can influence Swiss exports.
However, inflation in Switzerland has shown unexpected moderation. As of October 2025, inflation fell to just 0.1% year-on-year, which was below the market expectation of 0.3%. A likely factor behind this decrease is the decline in energy prices and a slowdown in private service costs. Lower inflation can encourage further rate cuts, as central banks seek to stimulate economic growth. This recent trend may play a crucial role in how the SNB adjusts its policies moving forward.
Looking ahead, various forecasts indicate that the exchange rate between the euro and Swiss franc (EUR/CHF) is projected to increase to 0.94 by June 2026, as the European Central Bank maintains steady interest rates. This movement suggests that while the CHF remains strong, other currencies might not strengthen in tandem, especially if the European economy struggles.
A key concern for the CHF’s strength comes from international trade dynamics. Not long ago, in July 2025, the U.S. imposed a striking 39% tariff on Swiss exports, a far harsher penalty compared to rates faced by the EU or the UK. This unexpected move sent shockwaves through Swiss markets, causing both the stock market and the CHF to decline. The fallout from such tariffs poses a significant threat to the foundations of Switzerland's export-driven economy, which could influence future SNB decisions regarding interest rates and currency management.
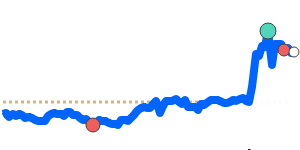
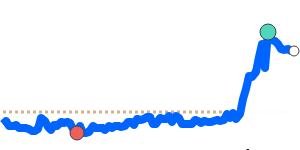
When analyzing specific exchange rate movements, the CHF has shown some resilience. Currently, the CHF to USD exchange rate stands at 1.2677, marking a 1.3% increase above its three-month average of 1.2517. This rate has remained stable within a tight 2.9% range from 1.2335 to 1.2691, which indicates a relatively predictable trading environment for businesses and travelers needing to convert currencies.
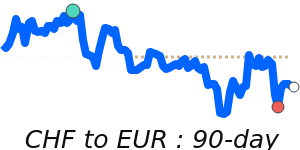
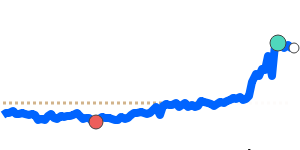
In terms of the CHF to Euro exchange rate, it is currently at 1.0767, quite close to its three-month average, having fluctuated within a narrow 1.9% range from 1.0648 to 1.0846. This stability suggests that for businesses handling transactions in euros, the risks of volatility are currently manageable.
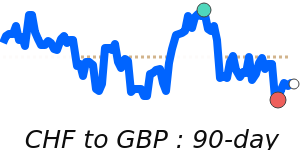
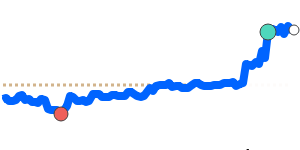
Contrastingly, the CHF to GBP is trading at 0.9384, just below its three-month average and maintained within a consistent range from 0.9300 to 0.9566. For businesses or individuals engaged in transactions involving British pounds, this slight underperformance may warrant caution considering the typically higher volatility of the GBP.
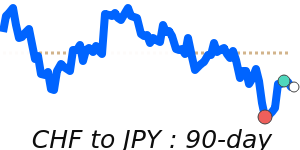
Lastly, the CHF to JPY exchange rate is registering at 197.8, which is significantly 2.6% above its three-month average of 192.8. The range of exchange movements has been relatively stable as well, within a 7.6% bandwidth from 184.5 to 198.6. This upward trend could present potential opportunities for exporters or businesses dealing with Japanese partners.
In conclusion, the outlook for the Swiss franc is steeped in a complex mixture of local monetary policy adjustments and significant external trade pressures. Stakeholders in international markets should remain vigilant, keeping an eye on future SNB actions, global economic conditions, and their impact on both inflation and currency strength. This awareness will be crucial for optimizing foreign exchange transactions and minimizing costs in the evolving global financial landscape.