CHF Market Update
27 Jun 2026 • 01:12 GMT
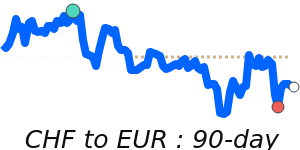
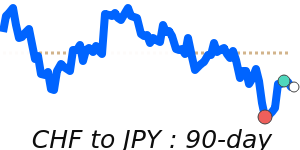
The Swiss franc remains relatively stable against most major currencies but is currently trading around 1.2351 against the US dollar, which is about 2.4% below its three-month average. The currency's strength is largely driven by its status as a safe haven amid ongoing global uncertainties. Despite the Swiss National Bank's commitment to intervene if the franc’s appreciation accelerates, the currency has strengthened by roughly 3.5% against the dollar earlier this year, reaching levels not seen in over a decade.
The USD's recent rally, fueled by rising expectations of a potential interest rate hike by the Federal Reserve, continues to influence exchange rates. However, the CHF is holding well within its recent ranges, with little volatility seen in its cross rates. Market participants are carefully watching for signs of intervention or economic shifts that might change the franc's direction.
Most forecasts suggest the USD/CHF will stay within the 0.78 to 0.80 range through the end of the year, balancing safe haven demand against US rate hike possibilities. Ongoing geopolitical tensions and central bank policies will be key factors in the currency's near-term moves.
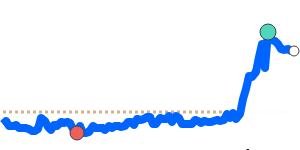
📊 Quick forecast view
🟢 Mild upside
1.2310 – 1.2530
🌍 Global risk sentiment
⚪ Range-bound