Switch .com Best Exchange Rates .com Best Exchange Rates .com Best Exchange Rates
BER

Israeli new sheqel Markets

ILS Currency Update - Our review of Israeli new sheqel forecasts and news plus charts and historic rates. Check ILS Trends over various time periods.


The USD to ILS exchange rate has exhibited notable movements recently, influenced by a mix of developments in both the US and Israeli markets. Analysts highlight that the US dollar has seen an uptick following the Federal Reserve's recent policy announcements, with expectations shifting regarding future interest rate cuts. However, a disappointing ISM manufacturing PMI report exerted downward pressure on the greenback, indicating potential weaknesses in the US manufacturing sector.

Market dynamics affecting the USD include discussions around a leadership change at the Federal Reserve, which could impact monetary policy direction. Upcoming inflation data, particularly the Consumer Price Index report, is also anticipated as a major factor that may influence the Fed's next decisions. Concurrently, US-China trade tensions remain a constant backdrop, as any developments could sway the dollar's strength.

On the Israeli side, the shekel has demonstrated considerable resilience, appreciating around 9.3% against the dollar in the second quarter of 2025. This strengthening is attributed to a decline in inflation to 2.5% in September 2025, now within the government's target range, which has sparked discussions about potential interest rate cuts by the Bank of Israel. Additionally, easing geopolitical tensions have improved investor sentiment toward Israel, further supportive of the shekel's value.

Market experts emphasize the revised forecasts from UBS, which have predicted a continued strengthening of the shekel, attributing this to decreased geopolitical risk and improved economic fundamentals in Israel. The USD/ILS exchange rate currently sits near 3.2689, indicating a 1.9% decrease from its three-month average of 3.3318. The rate has been relatively stable, oscillating between 3.2512 and 3.4578, demonstrating a predictable range despite ongoing global pressures.

As a result, traders and businesses should monitor these economic indicators closely, as shifts in monetary policy by either the Federal Reserve or the Bank of Israel could impact the USD/ILS exchange rates substantially in the near future.


US dollar to Israeli new sheqel - USD/ILS Trend

 
USD to ILS is at 7-day highs near 3.2689, 1.9% below its 3-month average of 3.3318, having traded in a relatively stable 6.4% range from 3.2512 to 3.4578
|
 
1 USD =
3.2746We compare provider deals to this wholesale mid-market rate. Read more
ILS
 
1d+0.3%
 
Track Rate

View My Rate Tracker


Compare & Save on Exchange Rates

Exchange rates can vary significantly between banks and currency exchange providers, so it's important to compare rates from different sources before making a conversion.

The below table makes it easy to calculate and compare the Total Cost you are being charged on currency rates and the possible savings of using a foreign exchange provider rather than your bank.


Loading exchange rates...


Top ILS Rates


Israeli new sheqel to US dollar
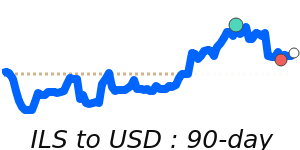
ILSUSD 90 day chart

ILS to USD is at 7-day lows near 0.3059, 1.9% above its 3-month average of 0.3002, having traded in a relatively stable 6.4% range from 0.2892 to 0.3076
ILS to USD
0.3054
1d−0.3%

Israeli new sheqel to Euro
ILS to EUR at 0.2664 is 3.5% above its 3-month average of 0.2573, having traded in a relatively stable 6.7% range from 0.2498 to 0.2666
ILS to EUR
0.2659
90dHighs
1d0.0%

Israeli new sheqel to Canadian dollar
ILS to CAD at 0.4315 is 3.5% above its 3-month average of 0.4171, having traded in a fairly volatile 8.5% range from 0.3983 to 0.4320
ILS to CAD
0.4314
1d+0.1%

Israeli new sheqel to British pound
ILS to GBP is at 90-day highs near 0.2350, 5.1% above its 3-month average of 0.2237, having traded in a fairly volatile 8.4% range from 0.2167 to 0.2350
ILS to GBP
0.2342
90dHighs
1d+0.6%

Israeli new sheqel to Indian rupee
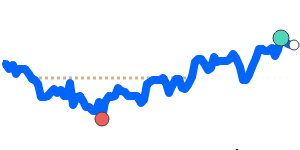
ILSINR 90 day chart

ILS to INR at 27.14 is 2.6% above its 3-month average of 26.46, having traded in a relatively stable 7.5% range from 25.38 to 27.29
ILS to INR
27.06
90dHighs
1d−0.3%

Israeli new sheqel to Japanese yen
ILS to JPY at 47.01 is 4.9% above its 3-month average of 44.83, having traded in a quite volatile 10.9% range from 42.68 to 47.35
ILS to JPY
46.94
90dHighs
1d−0.6%

Israeli new sheqel to Australian dollar
ILS to AUD is at 90-day highs near 0.4719, 2.9% above its 3-month average of 0.4588, having traded in a quite stable 5.7% range from 0.4466 to 0.4719
ILS to AUD
0.4711
90dHighs
1d+0.6%

Israeli new sheqel to Singapore dollar
ILS to SGD is at 90-day highs near 0.4003, 3.3% above its 3-month average of 0.3872, having traded in a relatively stable 7.5% range from 0.3724 to 0.4003
ILS to SGD
0.3991
90dHighs
1d0.0%

Israeli new sheqel to Chinese yuan
ILS to CNY at 2.1811 is 1.8% above its 3-month average of 2.1423, having traded in a quite stable 5.3% range from 2.0777 to 2.1878
ILS to CNY
2.1765
90dHighs
1d−0.2%