MXN Market Update
21 Jul 2026 • 00:31 GMT
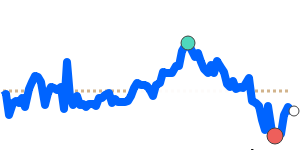
The Mexican peso remains relatively steady against the US dollar, trading near its 3-month average at around 0.057414 USD per MXN. Over recent weeks, the peso has maintained a narrow trading range, between 0.056800 and 0.058231, reflecting cautious investor sentiment. The Bank of Mexico’s decision to keep interest rates unchanged has supported the peso, which benefits from continued interest rate stability and positive risk appetite due to improved geopolitical relations.
Meanwhile, the USD stays firm globally, supported by persistent inflation and expectations of higher interest rates from the Federal Reserve. This scenario suggests some underlying pressure on the peso, but recent trading stability indicates traders are weighing continued monetary policy support from Banxico against US dollar strength.
Looking ahead, the peso could face volatility depending on US economic data, especially inflation reports, and further US monetary policy signals. However, barring unexpected shifts, the peso is likely to stay within its current range, with room for slight moves as global risk sentiment evolves. Overall, the peso remains resilient in a steady trading environment amid ongoing external uncertainties.
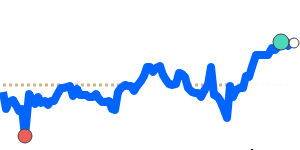
📊 Quick forecast view
🔴 Mild downside
0.0560 – 0.0570
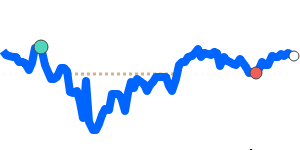
🌍 Global risk sentiment
⚪ Range-bound