Outlook
The NZD remains undermined by market risk aversion, with the kiwi softer as cautious sentiment weighs on demand for the risk-sensitive currency. Markets have priced in potential policy easing from the Reserve Bank of New Zealand, including an expected 50 basis-point cut at the next meeting, which would weigh on the currency unless offset by improving risk sentiment or stronger domestic data. Trade developments, such as the November 2025 tariffs lift on NZ food exports to the US, provide some support, while renewed US-China tensions and broader global trade frictions cap upside. High dairy prices continue to bolster New Zealand’s export income, offering a partial offset to downside pressures. Overall, the NZD is likely to remain on the defensive while risk conditions stay wary, unless clearer policy signals or a marked shift in global trade dynamics emerge.
Key drivers
- Market risk aversion continues to pressure the NZD as investors seek safer assets.
- RBNZ signals potential rate cuts, with expectations of a 50bp reduction at the next meeting.
- US trade moves support NZ exports (tariffs lifted on over 200 NZ food products), providing a modest tailwind for the NZD.
- Global trade tensions (notably US-China) add volatility and limit sustained upside.
- Elevated dairy prices bolster export income and support the NZD in a softer overall risk backdrop.
Range
NZD/USD at 0.6041 is 4.0% above its 3-month average of 0.5809, having traded in a fairly volatile 8.7% range from 0.5590 to 0.6077.
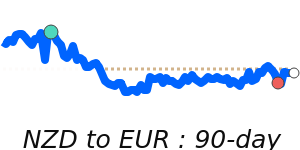
NZD/EUR at 0.5081 is 2.4% above its 3-month average of 0.4961, having traded in a quite stable 5.6% range from 0.4850 to 0.5122.
NZD/GBP at 0.4431 is 2.4% above its 3-month average of 0.4329, having traded in a very stable 3.8% range from 0.4268 to 0.4431.
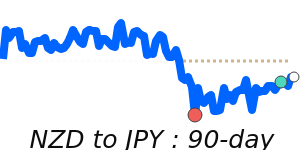
NZD/JPY at 93.33 is 2.8% above its 3-month average of 90.75, having traded in a fairly volatile 8.5% range from 87.39 to 94.79.
What could change it
- A shift in global risk appetite toward risk-on could lift the NZD.
- An unexpected RBNZ policy outcome (larger or smaller cut, or hawkish/dovish shift in guidance) would move the currency.
- Resolution or escalation of US-China trade tensions could alter risk sentiment and commodity/global trade flows.
- A material change in dairy prices or NZ export volumes would influence the NZD’s directional bias.
- Key NZ data surprises (inflation, GDP, employment) or shifts in US monetary policy could alter the currency trajectory.