Switch .com Best Exchange Rates .com Best Exchange Rates .com Best Exchange Rates
BER

Singapore dollar Markets

SGD Currency Update - Our review of Singapore dollar forecasts and news plus charts and historic rates. Check SGD Trends over various time periods.


The Singapore dollar (SGD) has recently been influenced by a combination of monetary policy adjustments, trade relations, and economic growth outlook. The Monetary Authority of Singapore (MAS) took a significant step in April by easing its monetary policy, marking the second instance this year. This decision involved reducing the rate of appreciation of the nominal effective exchange rate (S$NEER) policy band, reflecting concerns over global trade uncertainties and a downgraded GDP growth forecast of 0%-2% for 2025.

Trade dynamics have also been critical, especially with the United States imposing a 10% tariff on all goods from Singapore in April. The impact of these tariffs has prompted the Singaporean government to set up a task force to support affected businesses and workers. Despite facing these headwinds, the economy demonstrated resilience with a better-than-expected growth rate of 1.4% in Q2 2025. Nonetheless, the MAS decided to maintain its current policy settings, anticipating a moderation in growth for the latter half of the year.

Inflation rates are another essential component of the SGD's landscape. Recent trends indicate a decline in core inflation in Singapore, dropping to 0.6% in June from a peak of 5.5% in early 2023. This decrease has provided the MAS with the flexibility to keep its monetary policy unchanged, suggesting that inflationary pressures remain subdued.

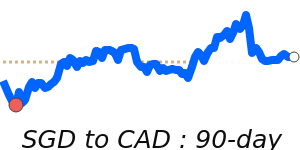
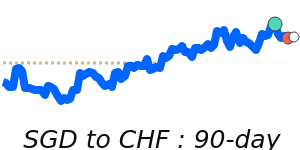
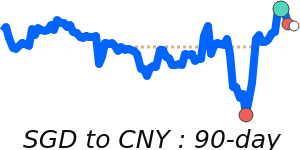
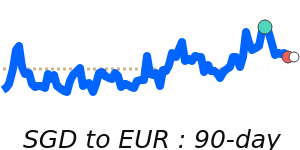
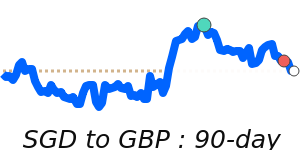
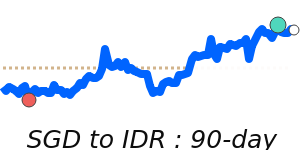
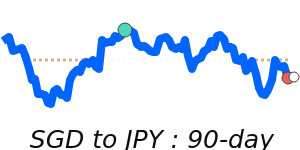
In currency market movements, the SGD to USD has recently reached 14-day highs near 0.7795, aligning closely with its 3-month average and exhibiting a stable range of 2.4%. In contrast, the SGD to EUR is at 14-day lows near 0.6673, which is 1.0% below its 3-month average and within a consistent trading range. Similarly, the SGD to GBP has hit 14-day lows near 0.5771, hovering near its 3-month average after remaining stable. Conversely, the SGD to JPY has risen to 7-day highs near 115.2, marking a 1.5% increase over its 3-month average, indicating some strength against the yen.

Analysts suggest that ongoing developments in trade relations and inflationary trends will play a crucial role in determining the future trajectory of the SGD. For individuals and businesses engaging in international transactions, these factors are essential to consider for optimizing exchange rates and minimizing costs.


Singapore dollar to US dollar - SGD/USD Trend

 
SGD to USD is at 14-day highs near 0.7795, near its 3-month average, having traded in a very stable 2.4% range from 0.7682 to 0.7864
|
 
1 SGD =
0.7808We compare provider deals to this wholesale mid-market rate. Read more
USD
 
+0.3%
14d-highs
 
Track Rate

View My Rate Tracker


Compare & Save on Exchange Rates

Exchange rates can vary significantly between banks and currency exchange providers, so it's important to compare rates from different sources before making a conversion.

The below table makes it easy to calculate and compare the Total Cost you are being charged on currency rates and the possible savings of using a foreign exchange provider rather than your bank.


Loading exchange rates...


Top SGD Rates


Singapore dollar to US dollar
SGDUSD 90 day chart

SGD to USD is at 14-day highs near 0.7795, near its 3-month average, having traded in a very stable 2.4% range from 0.7682 to 0.7864
SGD to USD
0.7808
+0.3%
14d-highs

Singapore dollar to Australian dollar
SGDAUD 90 day chart

SGD to AUD at 1.1936 is just below its 3-month average, having traded in a stable 1.8% range from 1.1860 to 1.2075
SGD to AUD
1.1927
+0.1%
14d-lows

Singapore dollar to Malaysian ringgit
SGDMYR 90 day chart

SGD to MYR at 3.2968 is just below its 3-month average, having traded in a very stable 2.2% range from 3.2697 to 3.3428
SGD to MYR
3.2851
+0.2%

Singapore dollar to Indian rupee
SGDINR 90 day chart

SGD to INR is at 90-day highs near 68.28, 1.8% above its 3-month average of 67.06, having traded in a very stable 4.0% range from 65.66 to 68.28
SGD to INR
68.28
+0.2%
90d-highs

Singapore dollar to Thai baht
SGDTHB 90 day chart

SGD to THB is at 14-day highs near 25.26, just below its 3-month average, having traded in a very stable 2.7% range from 25.00 to 25.67
SGD to THB
25.22
+0.1%
14d-highs

Singapore dollar to South Korean won
SGDKRW 90 day chart

SGD to KRW at 1079 is just 0.7% above its 3-month average of 1072, having traded in a very stable 2.8% range from 1053 to 1083
SGD to KRW
1,077.3
-0.2%
14d-highs

Singapore dollar to Philippine peso
SGDPHP 90 day chart

SGD to PHP at 44.33 is just 0.8% above its 3-month average of 43.98, having traded in a quite stable 4.5% range from 42.90 to 44.82
SGD to PHP
44.24
-0.1%

Singapore dollar to Hong Kong dollar
SGDHKD 90 day chart

SGD to HKD is at 14-day highs near 6.1179, near its 3-month average, having traded in a very stable 2.9% range from 5.9976 to 6.1731
SGD to HKD
6.1281
+0.3%
14d-highs

A-Z


Singapore dollar to Australian dollar
SGDAUD 90 day chart

SGD to AUD at 1.1936 is just below its 3-month average, having traded in a stable 1.8% range from 1.1860 to 1.2075
SGD to AUD
1.1927
+0.1%
14d-lows

Singapore dollar to Canadian dollar
SGDCAD 90 day chart

SGD to CAD is at 30-day highs near 1.0734, just above its 3-month average, having traded in a stable 1.7% range from 1.0598 to 1.0774
SGD to CAD
1.0743
+0.3%
30d-highs

Singapore dollar to Swiss franc
SGDCHF 90 day chart

SGD to CHF at 0.6285 is just below its 3-month average, having traded in a quite stable 4.4% range from 0.6197 to 0.6470
SGD to CHF
0.6286
-0.4%
30d-highs

Singapore dollar to Chinese yuan
SGDCNY 90 day chart

SGD to CNY at 5.5988 is near its 3-month average, having traded in a stable 1.8% range from 5.5336 to 5.6338
SGD to CNY
5.6017
+0.2%

Singapore dollar to Euro
SGDEUR 90 day chart

SGD to EUR is at 14-day lows near 0.6673, 1.0% below its 3-month average of 0.6741, having traded in a very stable 3.8% range from 0.6637 to 0.6891
SGD to EUR
0.6671
-0.2%
14d-lows

Singapore dollar to British pound
SGDGBP 90 day chart

SGD to GBP is at 14-day lows near 0.5771, near its 3-month average, having traded in a very stable 2.3% range from 0.5712 to 0.5846
SGD to GBP
0.5752
-0.2%
14d-lows

Singapore dollar to Hong Kong dollar
SGDHKD 90 day chart

SGD to HKD is at 14-day highs near 6.1179, near its 3-month average, having traded in a very stable 2.9% range from 5.9976 to 6.1731
SGD to HKD
6.1281
+0.3%
14d-highs

Singapore dollar to Indonesian rupiah
SGDIDR 90 day chart

SGD to IDR at 12670 is just below its 3-month average, having traded in a stable 1.5% range from 12622 to 12808
SGD to IDR
12,582
60d-lows

Singapore dollar to Indian rupee
SGDINR 90 day chart

SGD to INR is at 90-day highs near 68.28, 1.8% above its 3-month average of 67.06, having traded in a very stable 4.0% range from 65.66 to 68.28
SGD to INR
68.28
+0.2%
90d-highs

Singapore dollar to Japanese yen
SGDJPY 90 day chart

SGD to JPY is at 7-day highs near 115.2, 1.5% above its 3-month average of 113.5, having traded in a quite stable 4.8% range from 110.8 to 116.1
SGD to JPY
115.06
+0.1%

Singapore dollar to Malaysian ringgit
SGDMYR 90 day chart

SGD to MYR at 3.2968 is just below its 3-month average, having traded in a very stable 2.2% range from 3.2697 to 3.3428
SGD to MYR
3.2851
+0.2%

Singapore dollar to Philippine peso
SGDPHP 90 day chart

SGD to PHP at 44.33 is just 0.8% above its 3-month average of 43.98, having traded in a quite stable 4.5% range from 42.90 to 44.82
SGD to PHP
44.24
-0.1%

Singapore dollar to Pakistani rupee
SGD to PKR is at 14-day highs near 221.3, just above its 3-month average, having traded in a very stable 3.9% range from 215.8 to 224.2
SGD to PKR
221.71
+0.3%
14d-highs

Singapore dollar to Qatari rial
SGD to QAR at 2.8381 is near its 3-month average, having traded in a very stable 2.6% range from 2.7977 to 2.8693
SGD to QAR
2.8437
+0.3%
14d-highs

Singapore dollar to Saudi riyal
SGDSAR 90 day chart

SGD to SAR is at 14-day highs near 2.9254, near its 3-month average, having traded in a very stable 2.4% range from 2.8814 to 2.9494
SGD to SAR
2.9291
+0.3%
14d-highs

Singapore dollar to Thai baht
SGDTHB 90 day chart

SGD to THB is at 14-day highs near 25.26, just below its 3-month average, having traded in a very stable 2.7% range from 25.00 to 25.67
SGD to THB
25.22
+0.1%
14d-highs

Singapore dollar to New Taiwan dollar
SGDTWD 90 day chart

SGD to TWD at 23.30 is 1.0% above its 3-month average of 23.07, having traded in a very stable 2.9% range from 22.69 to 23.34
SGD to TWD
23.40
+0.1%
60d-highs

Singapore dollar to US dollar
SGDUSD 90 day chart

SGD to USD is at 14-day highs near 0.7795, near its 3-month average, having traded in a very stable 2.4% range from 0.7682 to 0.7864
SGD to USD
0.7808
+0.3%
14d-highs

Singapore dollar to Vietnamese dong
SGD to VND is at 14-day highs near 20461, just 0.7% above its 3-month average of 20319, having traded in a very stable 3.2% range from 19926 to 20559
SGD to VND
20,518
+0.4%
14d-highs